House prices frozen at £298,441: buy-to-let bargain or trap?
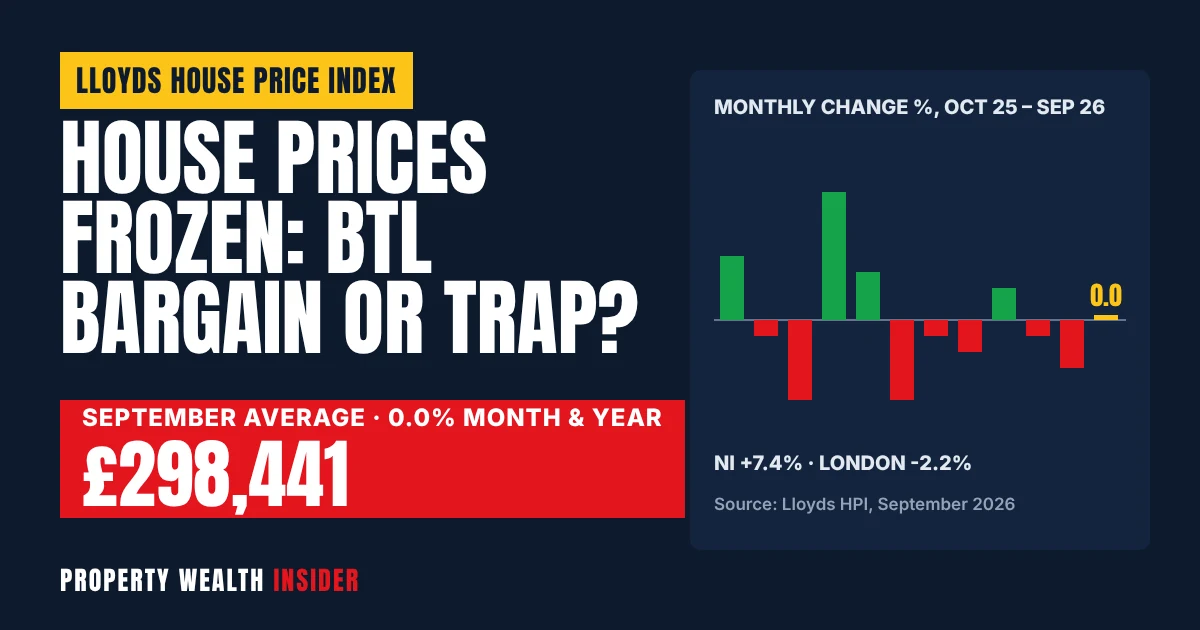
UK house prices did not move an inch in September. The Lloyds House Price Index, published on 7 October 2026, puts the typical home at £298,441, with prices unchanged on the month and unchanged on a year ago.
That follows a 0.3% fall in August, and it lands while mortgages are getting dearer, not cheaper. Bank of England figures show the average rate on newly drawn mortgages climbed to 4.60% in August, and buyers took out fewer mortgage approvals than they did a year ago.
For buy-to-let investors that is a two-sided story. Flat prices mean you are not chasing a rising market. But dearer borrowing squeezes the rent cover that lenders demand, and that decides how much you can borrow. Here is what the September numbers mean if you are thinking of buying now.
Key facts
- Lloyds average UK house price in September 2026: £298,441, with a monthly change of 0.0% and an annual change of 0.0%.
- Prices fell 0.3% in August, and the three-month change to September was -0.2%.
- Northern Ireland leads with annual growth of +7.4%. Greater London has the largest fall at -2.2%.
- Bank Rate is 3.75%, held on 17 September 2026. The next decision is due on 5 November 2026.
- Mortgage approvals for house purchase fell to 54,900 in August 2026, against 64,700 first reported for August 2025.
- The effective rate on new mortgages rose to 4.60% in August, up from 4.45% in July.
What the Lloyds September figures show
Lloyds now publishes the long-running index that used to carry the Halifax name. Its September 2026 release shows a standardised average price of £298,441. That is £46 more than August’s £298,395 and £128 less than September 2025’s £298,569. In other words, the price of a typical home is the same as it was a year ago.
Andrew Asaam, Mortgages Director at Lloyds, said property prices “have so far proved resilient during a period of higher mortgage rates”. He added that new enquiries from prospective buyers are at their highest since February.
Prices are holding steady, then. They are not crashing, and they are not recovering. If you are buying, that steadiness gives you time to negotiate. It does not give you an easy capital gain to cover a thin yield.
Twelve months of going nowhere
Over the past year the index has moved up and down in small steps and ended where it started. The peak was £301,051 in February 2026. Since then, six of the seven months have been flat or negative. August was the first month in the run where prices were lower than a year earlier (-0.4%).
Where prices are rising and falling
The UK figure hides a clear split between north and south. Northern Ireland’s annual growth rose to +7.4% (from 6.8%), and its average price of £231,917 is a record. Scotland is up 3.4% and Wales is up 1.2%. In England, only the North East, the North West and the West Midlands show annual growth.
The South is going the other way. Greater London is down 2.2% to £531,548, the South East is down 2.1% and Eastern England is down 1.6%. The Lloyds release does not give figures for the East Midlands, Yorkshire and the Humber or the South West, so we have left them out.
| Nation / region | Average price | Annual change | 25% deposit | SDLT on an additional property* |
|---|---|---|---|---|
| Northern Ireland | £231,917 | +7.4% | £57,979 | £13,734 |
| Scotland | £223,330 | +3.4% | £55,833 | n/a (LBTT applies) |
| North East | £184,546 | +2.4% | £46,137 | £10,418 |
| North West | £248,932 | +1.9% | £62,233 | £14,925 |
| Wales | £231,287 | +1.2% | £57,822 | n/a (LTT applies) |
| West Midlands | £260,892 | +0.8% | £65,223 | £16,089 |
| UK average | £298,441 | 0.0% | £74,610 | £19,844 |
| Eastern England | £330,151 | -1.6% | £82,538 | £23,015 |
| South East | £380,829 | -2.1% | £95,207 | £28,083 |
| Greater London | £531,548 | -2.2% | £132,887 | £43,155 |
*Stamp Duty Land Tax applies in England and Northern Ireland. Our figures use the current residential bands on GOV.UK plus the 5% higher rate that usually applies when you will own more than one home. The UK-average figure is shown for illustration. Scotland (LBTT) and Wales (LTT) have their own taxes and surcharges.
The takeaway is that up-front costs differ hugely. Buying a London property at the average price costs about £176,000 in deposit and stamp duty, before fees. In the North East it costs about £56,500. Those northern prices are also the ones still rising.
Dearer mortgages and fewer approvals
The Bank of England held Bank Rate at 3.75% on 17 September 2026, its third hold in a row after June and July. The next decision is on 5 November 2026.
Rates are not falling on the mortgages people actually take out. The Bank’s Money and Credit release for August 2026 shows the effective rate on newly drawn mortgages rose to 4.60%, up from 4.45% in July. A year earlier, the August 2025 release put it at 4.26%.
Mortgage approvals for house purchase fell to 54,900 in August, from 55,900 in July. That is roughly 10,000 fewer than the 64,700 first reported for August 2025. Remortgage approvals slipped to 34,000. Net mortgage lending rose to £4.4 billion.
Note: 4.60% is an average across all new mortgages, and most of those are residential. Buy-to-let products are priced separately, so always use your own lender or broker quote in the calculator below.
Buying opportunity or yield squeeze?
Here is the case for buying now. Prices have stopped rising, buyers are cautious, and approvals are down. That usually means less competition for the same stock and more sellers willing to negotiate. Lloyds also reports that buyer enquiries are picking up, so this window may not last.
Here is the case against. Flat prices give you no capital growth to lean on, so the deal has to work on rent. Higher rates also bite twice: once on your monthly interest, and again on the lender’s stress test.
The Prudential Regulation Authority’s buy-to-let underwriting rules (SS13/16) tell lenders to test affordability assuming rates rise by at least 2 percentage points, with a floor of 5.5%. Fixes of five years or more are exempt from that forward-looking test, which is why so many landlords pick five-year deals. The PRA notes that the industry-standard minimum interest cover ratio (ICR) is 125%. Some lenders set a higher bar, such as 145%, for higher-rate taxpayers.
Worked example: the UK-average buy
Say you buy at £298,441 with a 25% deposit (£74,610), borrowing £223,831 interest-only at 5.0%. Interest is about £933 a month. At £1,400 rent, the gross yield is 5.6%. After £2,400 a year of running costs, cashflow is about £267 a month before tax.
Now apply the stress test. On a five-year fix where the lender stresses at your 5.0% pay rate, you need £1,166 rent to hit 125% cover, or £1,352 for 145%. £1,400 passes both.
On a two-year fix, the lender stresses at 7.0% (your rate plus 2 points). Now you need £1,632 a month at 125%, or £1,893 at 145%. The same £1,400 rent supports a loan of only about £192,000 at 125%. That means a deposit of around £106,400 (36%) instead of £74,610. This is the yield squeeze in practice: the price has not moved, but the cash you need has.
Worked example: five years of flat prices
On interest-only borrowing, your equity only grows if prices do. If prices stay flat for five years, your equity stays at £74,610. At +2% a year, the home is worth about £329,500 and your equity is about £105,700. At -1% a year it falls to about £60,000. In a flat market, the rent profit is the return.
Buy-to-let deal checker at today’s prices
Enter your own figures. The price starts at the Lloyds UK average, and you can swap in a regional price from the table above. The checker shows yield, interest-only cashflow, whether the rent passes 125% and 145% cover at the lender’s stress rate, and your equity after five years.
Buy-to-let deal checker
Guide only, not financial advice. Stress rates and ICR thresholds vary by lender. Some lenders stress five-year fixes at a set rate rather than your pay rate. Excludes tax (individual landlords get only a basic-rate credit for mortgage interest), stamp duty, fees and capital repayment.
What to do now
- Price the deal on rent alone. Assume 0% price growth. If it only works with growth, it does not work in this market.
- Get a real BTL quote before offering. Ask your broker which stress rate and ICR the lender uses for your tax band, and whether you are buying personally or through a limited company.
- Compare five-year fixes with shorter deals on borrowing power. On a five-year fix, the stress rate can be much lower. That can mean tens of thousands of pounds less deposit.
- Use the regional split. Lower prices and positive growth in Northern Ireland, Scotland and northern England mean less cash tied up. In London, the South East and the East, prices are falling, which gives you room to negotiate.
- Negotiate hard. With approvals down and prices flat, ask for a discount, particularly on homes that have been on the market for a while.
- Budget for stamp duty and fees. The 5% higher rate adds almost £20,000 at the UK-average price in England and Northern Ireland.
- Watch 5 November. The next Bank Rate decision and the next Lloyds index (due 6 November) will show whether this pause is turning into a fall.
- Rent checked against at least three local comparables
- Gross yield and pre-tax cashflow worked out at 0% price growth
- Lender stress rate and ICR (125% or 145%) confirmed in writing
- Five-year fix compared with a two-year deal on maximum loan
- Stamp duty (or LBTT/LTT) higher rates added to the budget
- Running costs include voids, repairs, insurance and letting fees
- Tax position checked, including the restriction on mortgage interest relief
- Offer priced below asking, with evidence of recent local sales
FAQ
Are house prices falling in the UK?
Not overall, according to Lloyds. Prices were flat in September 2026 (0.0%) after a 0.3% fall in August, and they are unchanged on a year ago. Greater London, the South East and Eastern England are down year on year. Northern Ireland, Scotland, Wales and northern England are up.
What is the average house price in the UK right now?
The Lloyds House Price Index puts it at £298,441 for September 2026. Other indices, such as Nationwide’s and the official UK HPI, use different data and methods, so their averages will differ.
Is now a good time to buy a buy-to-let property?
It depends on the numbers for that property. Flat prices and fewer buyers help you negotiate, but higher rates make lender stress tests harder to pass. If the rent covers the stressed interest and still leaves positive cashflow at 0% growth, the deal stands on its own.
What rent do I need for a buy-to-let mortgage?
Lenders usually need rent of at least 125% of the interest at a stressed rate, and some ask for 145%. Under PRA rules, the stressed rate is at least 2 points above your rate, with a 5.5% floor, unless the rate is fixed for five years or more. Use the checker above to see the rent you need.
When is the next Bank of England interest rate decision?
The next announcement is on 5 November 2026. Bank Rate is currently 3.75%.
Sources
- Lloyds House Price Index
- Lloyds House Price Index, September 2026 (PDF)
- Bank of England: Bank Rate
- Bank of England: Money and Credit, August 2026
- Bank of England: Money and Credit, August 2025
- PRA Supervisory Statement SS13/16: underwriting standards for buy-to-let mortgage contracts
- GOV.UK: Stamp Duty Land Tax residential rates
This article is news and general guidance only. It is not financial, legal or tax advice.