House prices slip 0.2% as annual growth halves to 0.8%
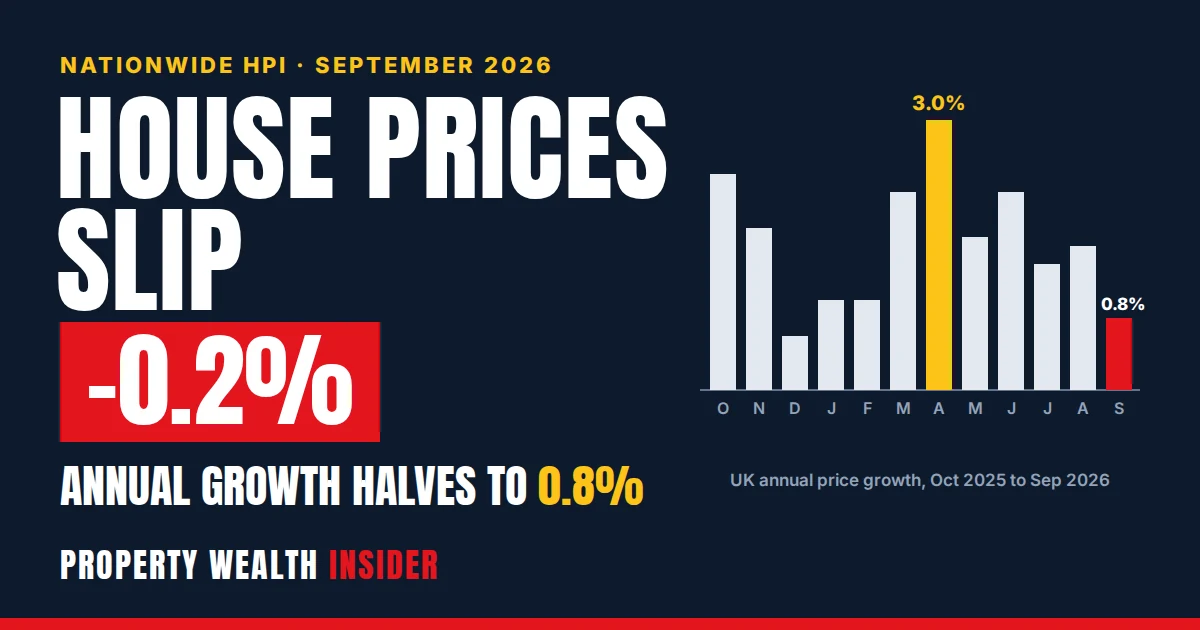
UK house prices fell 0.2% in September and annual growth halved to just 0.8%, according to Nationwide’s latest House Price Index, published on 1 October 2026. The average UK home now costs £274,251, down from £275,465 in August.
That is the weakest annual growth rate since December 2025. Nationwide’s quarterly figures also show a market splitting in two: prices are still climbing in Northern Ireland, Scotland and northern England, but four regions in the south and east are now lower than a year ago.
For landlords this matters most at the point of a remortgage, a sale or a purchase. Valuations drive your loan-to-value, and a flat or falling local market can quietly push you into a worse rate band. Below we break down the figures, map every region, and give you a tool to estimate where your own property stands today.
Key facts
- Average UK price in September 2026: £274,251, down 0.2% on the month (seasonally adjusted).
- Annual growth slowed to 0.8% from 1.6% in August, the weakest since December 2025.
- Northern Ireland was strongest in Q3 at +5.9%; the North West led England at +3.9%.
- East Anglia was weakest at -0.7%; South West, East Midlands and Outer Metropolitan were also negative.
- Terraced homes rose most (+1.8%); flats were essentially flat year on year.
- Bank Rate is 3.75%; the next MPC decision is due on 5 November 2026.
The September figures in full
Nationwide’s index is built from its own mortgage approvals. The headline monthly number is seasonally adjusted, while the average price is not, so the two are not directly comparable month to month.
| Measure | September 2026 | August 2026 |
|---|---|---|
| Average price (not seasonally adjusted) | £274,251 | £275,465 |
| Monthly change (seasonally adjusted) | -0.2% | +0.2% |
| Annual change | +0.8% | +1.6% |
| Monthly index (seasonally adjusted) | 548.3 | 549.6 |
Nationwide’s chief economist Robert Gardner put the weakness down partly to an uncertain economic backdrop, with conflict in the Middle East pushing up energy prices, fuelling inflation worries and driving up expectations of Bank Rate rises. Those expectations feed straight into the swap rates that lenders use to price fixed-rate mortgages.
There was a more positive note too. Nationwide says underlying affordability is improving because house price growth “has been well below earnings growth for some time”, and expects activity to regain momentum if the energy shock fades and market interest rates fall back.
Where prices are rising and falling
Nationwide publishes regional data quarterly. The Q3 figures cover the three months to September, so the UK average here (£276,157, up 1.2% a year) differs from the single-month headline.
Eight of the 13 regions saw annual growth below 1%, and four recorded small falls. England as a whole managed just 0.5%. Northern England (North, North West, Yorkshire & the Humber, East Midlands and West Midlands) was up 1.6%, while Southern England was down 0.1%.
| Region | Average price, Q3 2026 | Annual change, Q3 | Annual change, Q2 |
|---|---|---|---|
| Northern Ireland | £227,922 | +5.9% | +8.6% |
| North West | £231,360 | +3.9% | +3.9% |
| Scotland | £196,215 | +3.3% | +3.5% |
| North | £174,731 | +3.3% | +3.9% |
| Yorkshire & the Humber | £217,029 | +1.2% | +2.9% |
| Wales | £214,816 | +0.7% | +3.5% |
| West Midlands | £252,355 | +0.6% | +3.2% |
| London | £529,720 | +0.4% | +1.6% |
| Outer South East | £337,137 | 0.0% | +0.1% |
| Outer Metropolitan | £427,430 | -0.2% | +0.3% |
| South West | £305,180 | -0.3% | +0.7% |
| East Midlands | £237,449 | -0.5% | +1.8% |
| East Anglia | £272,119 | -0.7% | +0.3% |
| UK | £276,157 | +1.2% | +2.2% |
London was the only southern region with a rise, a modest 0.4%. Northern Ireland stayed top by a wide margin even though its growth slowed from 8.6% in Q2. Wales saw the biggest slowdown, from 3.5% to 0.7%, with the West Midlands not far behind (3.2% to 0.6%).
By property type, every category slowed in Q3. Terraced homes did best at 1.8%, while flats were essentially unchanged on a year ago. Over the longer run the gap is stark: since the start of 2020 a typical flat has risen 14%, against 31% for a semi-detached home.
The 12-month trend and the bigger picture
Annual growth has swung around this year. It peaked at 3.0% in April 2026 and has drifted lower since, with September’s 0.8% the lowest reading since December 2025’s 0.6%.
The official measure tells a similar story. The ONS and HM Land Registry UK House Price Index, based on completed sales and so running a couple of months behind, put the average UK price at £273,000 in July 2026, up 1.4% a year. That was down from a revised 1.5% in June and the third month in a row of slowing. The August figures are due on 21 October 2026.
On rates, the Bank of England held Bank Rate at 3.75% on 17 September 2026, with CPI inflation at 3.1% against its 2% target. The Bank warned inflation is likely to rise further as higher energy costs feed through. The next decision is due on 5 November 2026.
What is your property worth now?
Enter your last valuation (or purchase price if it was within the past year), how long ago that was, your outstanding mortgage and your region. The tool applies Nationwide’s Q3 2026 regional annual change, pro-rated for the months elapsed, and shows your estimated equity and loan-to-value.
Property value, equity and LTV checker
Guide only, not a valuation or financial advice. It applies a regional average change, which will not match every street or property type. Lender LTV bands vary; 60% and 75% are shown as common illustrative cut-offs. Get a surveyor or lender valuation before acting.
What it means for buying, selling and remortgaging
A national figure of 0.8% hides big local differences. Here is how the Q3 regional numbers play out on real-world sums. All examples apply Nationwide’s regional annual change to a valuation taken a year earlier.
Remortgaging in a falling region
A landlord in East Anglia had a property valued at £300,000 a year ago with a £225,000 interest-only mortgage, exactly 75% LTV. Apply the region’s -0.7% and the estimated value is £297,900. LTV rises to 75.5%, just over a common buy-to-let ceiling.
To get back to 75%, the loan would need to fall to £223,425, so about £1,575 of capital would need to be paid down, or the landlord takes a product at a higher LTV band if one is available. A small price move can change the rate you are offered.
Releasing equity in a rising region
In the North West, a house valued at £200,000 a year ago with a £150,000 loan (75% LTV) would now be estimated at £207,800 after the region’s 3.9% rise. LTV drops to 72.2% and equity grows to £57,800.
Borrowing back up to 75% would release roughly £5,850, before fees and subject to the lender’s rental cover test. That test, not the valuation, is often the real limit at today’s rates.
Selling a flat in London
London prices rose just 0.4% over the year and flats nationally were flat. A London flat worth £400,000 a year ago might be worth around £401,600 now, a paper gain of £1,600. If your agent charges 1% plus VAT, that fee alone would be about £4,819, wiping out a year’s growth. Sellers relying on price gains to cover costs should price realistically from day one.
Buying where prices are softening
If you are buying in a region where prices dipped, use that in negotiation. A comparable that sold for £275,000 a year ago in the East Midlands (-0.5%) points to around £273,625 today. Any asking price built on last year’s peak deserves a challenge, especially on flats.
Remember: these indices track averages based on mortgage approvals and completed sales. A lender’s valuer will look at local comparables, condition and property type. Treat the index as a direction of travel, not a price tag.
What to do now: step by step
- List every fixed-rate end date in your portfolio for the next 12 months. Many lenders let you secure a new product several months ahead.
- Re-estimate each property’s value using the checker above, then sense-check against recent sold prices on your street via HM Land Registry data.
- Flag anything within two or three points of an LTV band (such as 60%, 65% or 75%). These are the properties where a weak valuation could cost you a better rate.
- Check rental cover at the lender’s stress rate, not just LTV. With Bank Rate at 3.75%, rental cover is often the tighter constraint.
- Speak to a whole-of-market broker early, ideally before the next MPC decision on 5 November 2026, so you can lock a rate if pricing moves.
- Prepare valuation evidence: recent improvements, comparable sales and the current tenancy and rent, to help support the valuer’s figure.
- Review buy and sell plans region by region. Stronger northern markets and softer southern ones may call for different timing.
- Fixed-rate end dates listed for every mortgage
- Current estimated value and LTV worked out for each property
- Properties near 60% / 65% / 75% LTV bands flagged
- Rental cover calculated at lender stress rates
- Recent local sold prices checked on HM Land Registry data
- Broker contacted ahead of 5 November 2026 MPC decision
- Evidence pack ready for valuer (works, comparables, tenancy, rent)
- Asking or offer prices adjusted to the latest regional trend
FAQ
Are house prices falling in the UK?
Nationwide’s figures show a 0.2% monthly dip in September 2026, but prices are still 0.8% higher than a year ago across the UK. Four regions (East Anglia, East Midlands, South West and Outer Metropolitan) recorded small annual falls in Q3.
What is the average house price in the UK now?
Nationwide puts it at £274,251 for September 2026. The official UK House Price Index put it at £273,000 for July 2026, its latest month.
Which region has the fastest-rising house prices?
Northern Ireland, up 5.9% a year in Q3 2026. In England, the North West leads at 3.9%, followed by the North at 3.3%.
Why are Nationwide and the UK HPI figures different?
Nationwide uses its own mortgage approvals, so it is quicker but covers only its customers. The UK HPI uses completed sales registered with HM Land Registry and others, so it is broader but runs about two months behind.
Will interest rates go up in November 2026?
Nobody knows yet. The Bank of England held Bank Rate at 3.75% in September and will announce its next decision on 5 November 2026. Nationwide notes markets have been pricing in rate rises, which has kept mortgage rates higher.
Does a fall in house prices affect my buy-to-let remortgage?
It can. A lower valuation raises your loan-to-value, which may move you into a higher rate band or limit how much you can borrow. Check your estimated LTV with the tool above before your fixed rate ends.
Sources
- Nationwide: Annual house price growth halves in September (1 October 2026)
- Nationwide House Price Index: UK monthly data series
- Nationwide House Price Index: UK and regional quarterly data
- Bank of England: Bank Rate
- HM Land Registry / ONS: UK House Price Index summary, July 2026
This article is news and general guidance only. It is not financial, legal or tax advice.