Rental yields revealed: 6.9% top spot vs 2.9% at the bottom

Newcastle upon Tyne is the best place in England and Wales to earn a gross rental return right now, at an estimated 6.9%. Derbyshire Dales is the worst, at just 2.9%. That is the result when you take the official August 2026 house price and rent figures for each local authority and put them side by side.
We ran the numbers ourselves for all 316 council areas that have both an Office for National Statistics (ONS) rent figure and a UK House Price Index (UK HPI) price for August 2026. Only 14 of them reach a 6% gross yield. The typical (median) area returns about 4.4%.
For anyone buying, remortgaging or deciding whether to sell, this matters. Gross yield is only the starting point. After costs, voids, mortgage interest and the property income tax rates that arrive in April 2027, many of these returns shrink fast. Our calculator below shows what is left.
Key facts
- Highest estimated gross yield: Newcastle upon Tyne, 6.9% (average price £211,255, average rent £1,215 a month).
- Lowest: Derbyshire Dales, 2.9%, then Elmbridge (3.1%), Waverley (3.1%) and Powys (3.1%).
- England in August 2026: average price £293,525, average rent £1,459 a month, a headline gross yield of about 6.0%. Wales: 4.7%.
- Only 14 of 316 local authorities in England and Wales hit 6% or more. The median area is 4.4%.
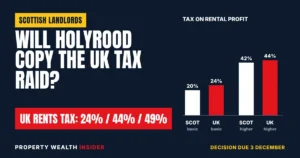
- Budget 2026 (28 October) announced that from 6 April 2027 individual landlords’ rental profits will be taxed at 24%, 44% and 49% in England, Wales and Northern Ireland, still to be legislated in Finance Bill 2026-27.
The 15 highest-yielding areas
The top of the table is dominated by big university and city-centre markets. Newcastle, Portsmouth, Manchester, Nottingham, Southampton, Bristol and Salford all have large rental populations and rents that are high relative to local prices.
The surprise is Tower Hamlets in third place at 6.6%. Its average price (£447,950) is well below the London average, while its average rent (£2,453 a month) is above it. Newham, also in east London, makes the top 15 at just under 6% (5.96%). Merthyr Tydfil is the only Welsh area in the list.
| Rank | Local authority | Region / nation | Average price (Aug 2026) | Average rent pcm (Aug 2026) | Gross yield |
|---|---|---|---|---|---|
| 1 | Newcastle upon Tyne | North East | £211,255 | £1,215 | 6.9% |
| 2 | Portsmouth | South East | £245,954 | £1,368 | 6.7% |
| 3 | Tower Hamlets | London | £447,950 | £2,453 | 6.6% |
| 4 | Manchester | North West | £256,760 | £1,373 | 6.4% |
| 5 | City of Nottingham | East Midlands | £189,547 | £1,014 | 6.4% |
| 6 | Southampton | South East | £235,729 | £1,257 | 6.4% |
| 7 | City of Bristol | South West | £353,596 | £1,883 | 6.4% |
| 8 | Salford | North West | £223,323 | £1,170 | 6.3% |
| 9 | Blackpool | North West | £138,065 | £719 | 6.2% |
| 10 | Lincoln | East Midlands | £182,294 | £942 | 6.2% |
| 11 | Gateshead | North East | £156,036 | £804 | 6.2% |
| 12 | City of Kingston upon Hull | Yorkshire and The Humber | £136,593 | £694 | 6.1% |
| 13 | Merthyr Tydfil | Wales | £148,656 | £754 | 6.1% |
| 14 | Norwich | East of England | £227,535 | £1,142 | 6.0% |
| 15 | Newham | London | £388,045 | £1,928 | 6.0% |
Just outside the top 15 sit Middlesbrough (5.9%), Liverpool (5.8%), Sunderland (5.7%), Birmingham (5.6%) and Leeds (5.6%).
The 10 lowest-yielding areas
The bottom of the table is a mix of wealthy commuter belt and rural beauty spots. In Elmbridge and Waverley in Surrey, prices are so high that even rents of £1,891 and £1,459 a month only return about 3.1%.
In Derbyshire Dales, Powys, Malvern Hills and the Forest of Dean the problem is the other way round: rents are modest (£621 to £946 a month) but homes still cost £237,000 to £350,000.
| Rank | Local authority | Region / nation | Average price (Aug 2026) | Average rent pcm (Aug 2026) | Gross yield |
|---|---|---|---|---|---|
| 316 | Derbyshire Dales | East Midlands | £341,776 | £819 | 2.9% |
| 315 | Elmbridge | South East | £735,548 | £1,891 | 3.1% |
| 314 | Waverley | South East | £559,306 | £1,459 | 3.1% |
| 313 | Powys | Wales | £237,042 | £621 | 3.1% |
| 312 | Malvern Hills | West Midlands | £349,550 | £946 | 3.2% |
| 311 | Uttlesford | East of England | £468,166 | £1,289 | 3.3% |
| 310 | Forest of Dean | South West | £296,807 | £828 | 3.4% |
| 309 | East Devon | South West | £345,256 | £968 | 3.4% |
| 308 | Mole Valley | South East | £552,344 | £1,551 | 3.4% |
| 307 | South Hams | South West | £360,616 | £1,012 | 3.4% |
Prime central London is low too. Kensington and Chelsea has the highest rent in the country at £3,690 a month, but with an average price of £1,204,072 its gross yield is only 3.7%. Westminster comes in at 4.3%.
Region by region: why the England figure flatters
Here is something most yield league tables skip. The headline England figure of about 6.0% is higher than every single English region when you calculate each one on the same basis.
| Area | Average price (Aug 2026) | Average rent pcm (Aug 2026) | Gross yield |
|---|---|---|---|
| North East | £165,640 | £788 | 5.7% |
| North West | £220,393 | £969 | 5.3% |
| London | £554,430 | £2,332 | 5.0% |
| Yorkshire and The Humber | £209,266 | £865 | 5.0% |
| South West | £304,139 | £1,245 | 4.9% |
| West Midlands | £250,731 | £982 | 4.7% |
| East of England | £337,848 | £1,289 | 4.6% |
| East Midlands | £241,955 | £922 | 4.6% |
| South East | £379,953 | £1,426 | 4.5% |
| England | £293,525 | £1,459 | 6.0% |
| Wales | £216,363 | £846 | 4.7% |
How can the whole be bigger than every part? The two averages are built from different things: rents come from the rental market, prices from homes sold, and the mix of locations and property types differs between them. The result is that the England headline is not a typical yield.
The practical point: do not judge a deal against “6% is average”. Across the 316 areas, 301 come in below the England headline. A gross yield of 5% or more is better than most of the country on these figures.
How we calculated these yields
We used two official datasets released by the ONS on 21 October 2026:
- Rent: the average monthly private rent for August 2026 for each local authority, from the Price Index of Private Rents (PIPR). This covers new and existing tenancies, not just advertised rents.
- Price: the average price for August 2026 for each local authority, from the UK House Price Index monthly price statistics, which is produced with HM Land Registry.
Gross yield is the monthly rent × 12, divided by the price. Newcastle: £1,215 × 12 = £14,580 a year, divided by £211,255 = 6.9%. We matched areas on their official codes. The City of London has no rent figure, so it is excluded.
Treat the results as a guide, not a valuation. Both August figures are provisional and can be revised; the ONS says UK HPI first estimates were based on around 53% of Great Britain sales for the month. The averages also mix property types: rented homes in a city are often smaller flats, while sales include family houses. A flat you buy may yield more or less than the area figure. This analysis covers England and Wales only; the ONS advises caution when comparing Scotland and Northern Ireland rent figures with the rest of the UK because of data collection differences.
Gross vs net: what a 6.9% yield really pays
Gross yield ignores every cost. Here is an example using the Newcastle averages and some typical assumptions (yours will differ): 12% letting and management fee, two weeks empty a year, £1,200 maintenance, £350 insurance and £6,000 a year mortgage interest.
- Rent if fully let: £14,580. Two void weeks cost about £561, leaving £14,019 collected.
- Fees at 12%: £1,682. Maintenance and insurance: £1,550. That leaves £10,787 before the mortgage, a net yield of 5.1%.
- Basic-rate taxpayer in 2027-28, at the announced 24% property basic rate: tax of 24% on £10,787 (£2,589) less a 24% credit on £6,000 interest (£1,440) = £1,149. (The credit follows the property basic rate; see the tax section below.)
- Cash left after interest and tax: about £3,638 a year, or £303 a month.
Run the same costs on Derbyshire Dales (£341,776 price, £819 rent) and the gross yield of 2.9% falls to roughly 2.0% net before any mortgage. Use the calculator to test your own property.
Rental yield and cash flow calculator
Guide only, not financial or tax advice. Assumes the property is held personally by a UK taxpayer in England or Northern Ireland, the whole profit falls in the band you choose, the 2027-28 rates are the Budget 2026 announcement (not yet law), mortgage interest gets a tax credit at the property basic rate (assumed 24% in 2027-28, 20% now), and any unused credit is ignored (in reality it can be carried forward). Scottish and Welsh taxpayers may have different rates. Comparison figures: England 6.0% and median local authority 4.4% gross, August 2026.
How the April 2027 tax rise hits your yield
Landlords face a double rise. The Finance Act 2026 already created separate income tax rates for property income from 6 April 2027, set at 22%, 42% and 47%. Then Budget 2026, on 28 October 2026, announced a further 2 percentage points, taking them to 24%, 44% and 49%. That second rise is announced policy, to be legislated in Finance Bill 2026-27, so it is not yet law.
| Band | 2026-27 (now) | 2027-28 in Finance Act 2026 | 2027-28 announced in Budget 2026 |
|---|---|---|---|
| Basic rate | 20% | 22% | 24% |
| Higher rate | 40% | 42% | 44% |
| Additional rate | 45% | 47% | 49% |
| Tax credit on mortgage interest | 20% (basic rate) | Property basic rate (22%) | Property basic rate (24% if legislated as announced) |
HMRC’s Budget 2026 policy paper says the rates apply to individuals in England, Wales and Northern Ireland, and that the Scottish and Welsh governments can set property income rates within their existing income tax powers. The Finance Act 2026 also changed the Section 24 relief for mortgage interest and other finance costs so it is given at the property basic rate. The Budget papers do not state a separate relief figure, but under that rule the credit would be 24% if the new basic rate is legislated as announced. These rates apply to individuals and partnerships; companies pay corporation tax instead.
Worked example: a higher-rate landlord with £10,787 profit before interest and £6,000 interest. In 2026-27 the tax is 40% × £10,787 (£4,315) less 20% × £6,000 (£1,200) = £3,115. At the announced 2027-28 rates it is 44% × £10,787 (£4,746) less 24% × £6,000 (£1,440) = £3,306. That is £191 more a year. The higher credit on interest cushions mortgaged landlords; a cash buyer with the same profit would pay £431 more (4% of £10,787).
What to do now
- Work out your real gross yield. Use your current rent and a realistic value, not the price you paid years ago. Compare it to your area in the tables above.
- Convert it to net. Put your actual fees, voids, maintenance and insurance into the calculator. Net yield is the figure that pays the mortgage.
- Stress-test the mortgage. Add a higher interest figure to see where your cash flow turns negative before your next fixed rate ends.
- Re-run it for 2027-28. Switch the tax year in the calculator so you know your post-April 2027 position in advance.
- Check like for like before buying. Area averages mix property types. Get rents for the exact property type and street from local agents before relying on an area yield.
- Talk to an accountant about ownership structure, especially if you are a higher-rate taxpayer or planning to grow.
- Current market value and rent for each property noted
- Gross and net yield calculated for each property
- Letting fees, voids, maintenance and insurance costed from last year’s accounts
- Mortgage end dates and likely new rates listed
- Cash flow re-run at 2027-28 property tax rates
- Local agent rent check done for any purchase you are considering
- Accountant review booked before 6 April 2027
FAQs
Where is the highest rental yield in England?
On official August 2026 averages, Newcastle upon Tyne has the highest estimated gross yield at 6.9%, followed by Portsmouth (6.7%) and Tower Hamlets (6.6%).
What is a good rental yield in the UK?
On these figures the median local authority in England and Wales returns about 4.4% gross, and only 14 of 316 areas reach 6%. Anything above 5% gross is better than most areas, but what counts is the net yield and cash flow after your own costs.
How do you calculate rental yield?
Gross yield is annual rent divided by the property price, times 100. Net yield takes off running costs such as fees, voids, maintenance and insurance first. £1,000 a month on a £200,000 home is a 6% gross yield.
What is the average rental yield in Wales?
About 4.7% gross in August 2026, based on an average price of £216,363 and average rent of £846 a month. Merthyr Tydfil was the highest Welsh area at 6.1%; Powys the lowest at 3.1%.
Is landlord tax going up in April 2027?
Yes, for individual landlords. Budget 2026 announced property income rates of 24%, 44% and 49% from 6 April 2027 in England, Wales and Northern Ireland, to be legislated in Finance Bill 2026-27. That replaces the 22%, 42% and 47% already in the Finance Act 2026. Mortgage interest relief is given at the property basic rate. Scotland and Wales can set their own property rates.
- ONS: Private rent and house prices, UK: October 2026
- ONS: Price Index of Private Rents, UK: monthly price statistics (dataset, 21 October 2026)
- ONS: UK House Price Index: monthly price statistics (dataset, 21 October 2026)
- HM Land Registry: UK House Price Index for August 2026
- Finance Act 2026, section 7: property rates for 2027-28 as originally set
- HM Treasury: Budget 2026 document (28 October 2026)
- HMRC policy paper: Income Tax, changes to tax rates for property and savings income (29 October 2026)
- Finance Act 2026, Schedule 1: finance cost relief given at the property basic rate
- GOV.UK: Income Tax rates and Personal Allowances
- GOV.UK: Tax relief for residential landlords, how it is worked out
This article is news and general guidance, not financial, legal or tax advice.