Rents up 3.8% to £1,406 as house price growth stalls at 0.9%
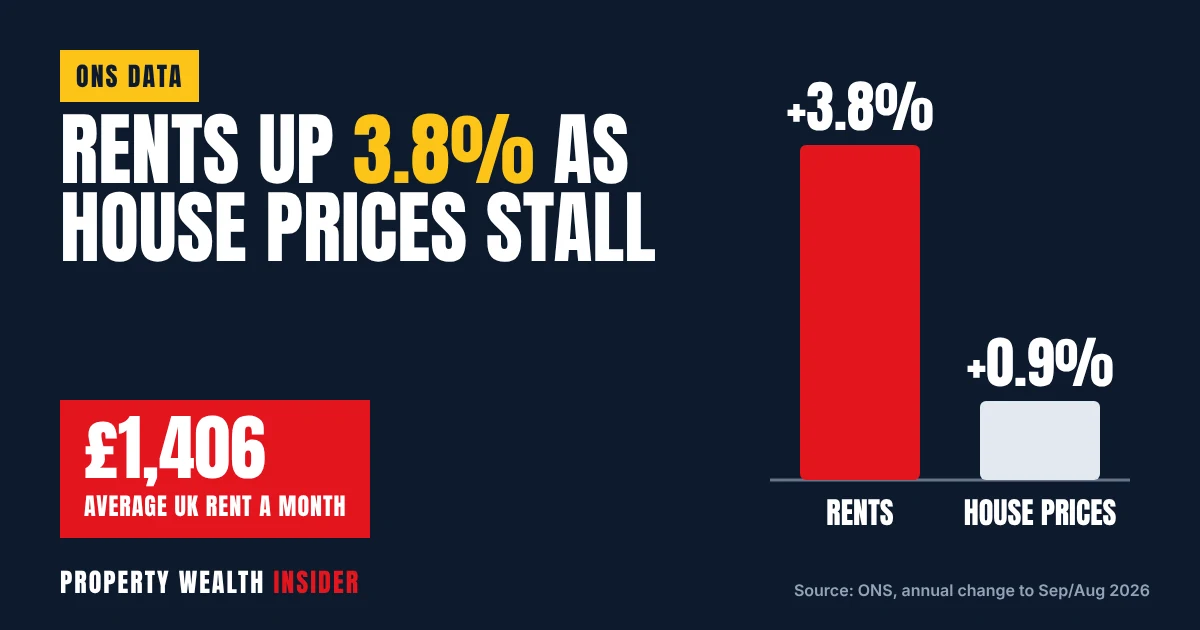
The average private rent in the UK hit £1,406 a month in September 2026, up 3.8% on a year earlier, according to the Office for National Statistics. House prices, meanwhile, are barely moving: the average UK home was worth £273,000 in August, just 0.9% more than a year before.
That gap matters. Rents are now growing more than four times faster than house prices, and the slowdown in prices has run for four months in a row. For landlords, that points to income doing the heavy lifting while capital growth stalls, especially in London and the South East, where prices are falling.
The figures come from the ONS release Private rent and house prices, UK: October 2026, published on 21 October 2026. Below we break down every region, work out rough gross yields, and recap the rent increase rules now in force in England.
Key facts
- Average UK private rent: £1,406 a month in September 2026, up 3.8% (£52) in a year, the same annual rate as August.
- Average UK house price: £273,000 in August 2026, up only 0.9%, down from 1.2% in July.
- Fastest rent growth in England: North West, 5.7%. Slowest: London and the South East, both 3.5%.
- Scotland rents up just 0.7% to £1,011, the lowest annual rate since the ONS series began in January 2016.
- London house prices down 2.2% in a year, dragged down by flat prices falling 5.0%.
- In England, rent can only be raised once a year using Form 4A with at least 2 months’ notice under the Renters’ Rights Act, in force since 1 May 2026.
The headline numbers
The ONS Price Index of Private Rents (PIPR) covers both new lets and existing tenancies, so it moves more slowly than asking-rent indices from property portals. It became full “official statistics” on 20 May 2026.
UK rent growth has cooled sharply from its peak of 9.1% in March 2024, bottoming out at 3.3% in May and June 2026. It has since edged back up to 3.7% in July and 3.8% in both August and September.
Across the nations, average rents in September 2026 were £1,466 in England (up 4.0%), £848 in Wales (up 4.1%) and £1,011 in Scotland (up 0.7%). Northern Ireland data runs two months behind: £879 in July 2026, up 1.7%.
Worked example: a tenant paying the UK average a year ago was on about £1,354 a month. At £1,406 they now pay £52 a month more, or £624 a year. If rents rise by another 3.8% over the next year, that average would reach about £1,459.
Rents region by region
The North had the fastest rent growth in England. The North West led at 5.7%, followed by the North East at 5.3% and Yorkshire and The Humber at 4.8%. London and the South East were lowest, both at 3.5%, though London is still by far the most expensive place to rent at £2,338 a month.
| Area | Average rent (Sep 2026) | Rent: annual change | Average house price (Aug 2026) | Price: annual change |
|---|---|---|---|---|
| North East | £790 | +5.3% | £165,640 | +3.2% |
| North West | £975 | +5.7% | £220,393 | +2.2% |
| Yorkshire and The Humber | £869 | +4.8% | £209,266 | +1.8% |
| East Midlands | £928 | +3.8% | £241,955 | +0.5% |
| West Midlands | £983 | +4.4% | £250,731 | +1.2% |
| East of England | £1,298 | +3.8% | £337,848 | +0.2% |
| London | £2,338 | +3.5% | £554,430 | -2.2% |
| South East | £1,438 | +3.5% | £379,953 | -0.8% |
| South West | £1,251 | +4.2% | £304,139 | 0.0% |
| England | £1,466 | +4.0% | £293,525 | +0.4% |
| Wales | £848 | +4.1% | £216,363 | +3.1% |
| Scotland | £1,011 | +0.7% | £198,397 | +2.9% |
| Northern Ireland | £879 (Jul) | +1.7% (Jul) | £202,487 (Q2) | +9.2% (Q2) |
| UK | £1,406 | +3.8% | £273,037 | +0.9% |
House prices are UK HPI figures for August 2026 (provisional). Northern Ireland prices are quarterly, for April to June 2026. Rents for the latest months are provisional and can be revised.
Locally, the gap is huge. The ONS puts the highest average rent at £3,739 in Kensington and Chelsea and the lowest at £556 in Dumfries and Galloway. Outside London, Oxford is the most expensive at £1,957.
Bigger homes cost more, as you would expect. Across the UK, one-bed homes averaged £1,140 a month and homes with four or more bedrooms £2,089.
House prices: the slowdown in detail
UK annual house price growth slowed to 0.9% in August 2026, from 1.2% in July. The ONS says this is the fourth month in a row of slowing, with annual rates falling in six of the nine English regions.
London is the weak spot. Prices there fell 2.2% in the year to August, although that is an improvement on the 3.2% fall in July. The average London price is now £15,000 below its July 2025 peak of £569,000. London flat prices fell 5.0%, while house prices rose, and flats make up about half of London sales.
Prices are still rising elsewhere. The North East led England at 3.2%, Wales rose 3.1% and Scotland 2.9%. Northern Ireland was up 9.2% in the second quarter of 2026, its highest annual rate since late 2022.
Worked example: on the UK average price of £273,037, 0.9% growth adds roughly £2,460 of paper value in a year. On a London flat bought at the regional average of £554,430, a 5.0% fall would wipe off about £27,700. Rent is now the dependable part of the return.
What it means for yields
When rents rise faster than prices, gross yields go up. Gross yield is simply annual rent divided by property value. It ignores costs such as mortgage interest, letting fees, repairs and voids, so it is a starting point, not a profit figure.
Using the ONS regional averages gives a rough benchmark. The North East comes out highest of the English regions at about 5.7% (£790 x 12 ÷ £165,640). The South East is lowest at about 4.5% (£1,438 x 12 ÷ £379,953). London lands at about 5.1%.
Health warning: these are averages of different things. The rent figure covers every privately rented home, and the price figure covers homes that sold. The mix of homes in each can differ, so these ratios are rough guides only. Mixing averages also explains why the England and UK ratios come out higher than any single region: London’s high rents carry a lot of weight in the rent average. Use your own rent and valuation in the calculator for a real answer.
Rent vs house price yield calculator
Pick a region to load the latest ONS average rent and UK HPI average price, or type in your own rent and value. Set the increase you are thinking about to see the new rent and how it compares with the local average.
Rent vs house price yield calculator
Guide only, not financial advice. Regional figures are ONS average private rent (September 2026; Northern Ireland July 2026) and UK HPI average price (August 2026; Northern Ireland April to June 2026). Gross yield ignores mortgage costs, fees, repairs, voids and tax. In England, rent can only be increased once a year via a Form 4A notice and can be challenged if above open market rent.
Raising rent in England: the rules now
Rising market rents do not mean you can raise rent whenever you like. Since the main parts of the Renters’ Rights Act came into effect on 1 May 2026, every private rent increase in England has to use one statutory route. These rules apply to England only. Wales, Scotland and Northern Ireland have their own systems.
- One route only: serve Form 4A, the section 13 notice proposing a new rent. Rent review clauses in tenancy agreements can no longer be used to raise rent.
- Notice: give at least 2 months’ notice before the new rent starts.
- Frequency: no more than one increase a year.
- Challenge: a tenant who thinks the new rent is above the open market rent can apply to the First-tier Tribunal before the new rent starts. The tribunal cannot set a rent higher than the one you proposed. The new rent applies from the date of its decision, not backdated, and in cases of undue hardship the tribunal can delay it by up to 2 more months.
Worked example: a North West landlord charging the regional average of £975 who serves Form 4A on 2 November 2026 cannot start the new rent before early January 2027. An increase in line with the region’s 5.7% growth would take the rent to about £1,031, an extra £56 a month or roughly £667 a year. If the tenant challenges it, the uplift starts only from the tribunal’s decision. Asking for well above the market can cost you months of the increase.
What landlords should do now
- Benchmark your rent. Compare it with the ONS local authority figures and with current asking rents for similar homes nearby. Regional averages are a sense check, not evidence for your specific property.
- Check your last increase date. If you raised the rent in the past 12 months, you cannot serve another increase yet.
- Gather comparables. Save three to five listings of similar homes in the same area, with dates. That is your case if the tenant goes to tribunal.
- Price for the market, not the maximum. A small, well-evidenced rise usually beats a big one that gets challenged and delayed, and it keeps good tenants.
- Use the current Form 4A from GOV.UK. Serve it correctly and keep proof of service.
- Re-run your numbers. With flat prices weak in London and the South East, base portfolio decisions on net yield and cash flow, not hoped-for capital growth.
- Current rent compared with ONS local and regional averages
- Date of last rent increase recorded (12-month rule)
- 3-5 dated comparable listings saved
- Latest Form 4A downloaded from GOV.UK
- Start date at least 2 months after the notice is served
- Proof of service kept on file
- Gross and net yield re-checked at the new rent
FAQ
What is the average rent in the UK right now?
£1,406 a month in September 2026, according to the ONS, up 3.8% on a year earlier. In England it is £1,466, in Wales £848 and in Scotland £1,011. Northern Ireland was £879 in July 2026.
Where are rents rising fastest?
Among English regions, the North West (5.7%), the North East (5.3%) and Yorkshire and The Humber (4.8%). London and the South East had the slowest growth, both at 3.5%. Scotland was lowest of the UK nations at 0.7%.
Are house prices falling?
Not across the UK as a whole. Prices were up 0.9% in the year to August 2026, but that growth has slowed for four months. Prices fell in London (-2.2%) and the South East (-0.8%) and were flat in the South West.
How often can a landlord put the rent up in England?
Once a year, using Form 4A with at least 2 months’ notice, under the rules in force since 1 May 2026. The tenant can challenge an increase at the First-tier Tribunal if they think it is above the open market rent.
What is a good rental yield in the UK?
It depends on your costs and borrowing. Rough benchmarks from the latest ONS averages put gross yields at about 4.5% to 5.7% across English regions, with the North East highest and the South East lowest. Always check your net yield after costs.
Sources
- ONS: Private rent and house prices, UK: October 2026
- ONS: Price Index of Private Rents, UK: monthly price statistics
- ONS: UK House Price Index: monthly price statistics
- GOV.UK: Renters’ Rights Act: an overview for landlords
- GOV.UK: Guide to the Renters’ Rights Act
- GOV.UK: Assured tenancy forms (Form 4A)
This article is news and general guidance only. It is not financial, legal or tax advice.