Rent Growth Slows to 3.8% – London Tenants Need £70,140 Salary
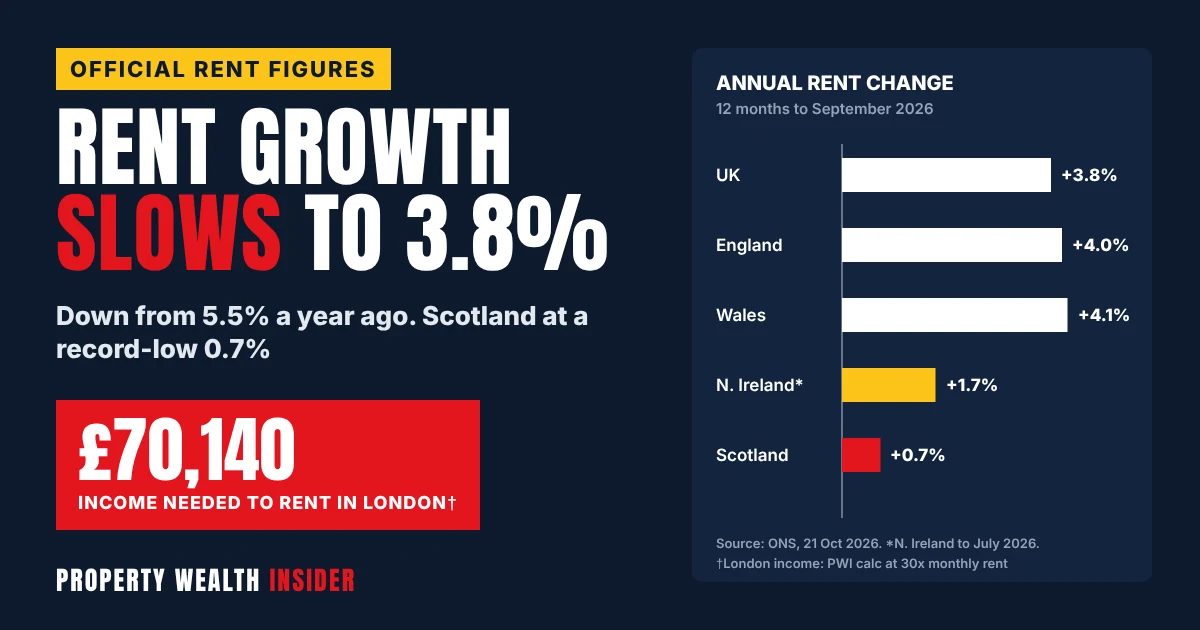
Official figures out today show UK private rents rose 3.8% in the year to September 2026, to an average of £1,406 a month. That’s well down on the 5.5% rate a year earlier, and Scotland has all but stalled at 0.7%, the lowest annual rise on record for its series.
The slowdown matters because rents have already hit a ceiling set by tenants’ pay. At the 30-times-rent income test most referencing firms use, a household now needs £70,140 a year to pass on the average London rent of £2,338, and £42,180 at the UK average.
If you have a tenancy ending or a new let to fill this autumn, this is the moment to price on evidence, not habit. Below we break down every region, show where the affordability line sits, and give you a calculator that compares holding your price with a small cut.
Key facts
- UK average private rent: £1,406 a month, up 3.8% in the year to September 2026 (provisional), against 5.5% a year earlier.
- Scotland: £1,011, up just 0.7%, the lowest annual change on record for the series. Rents there slipped 0.1% in September alone.
- London: £2,338, up 3.5%, joint slowest in England with the South East. The North West is fastest at 5.7%.
- Income needed at 30x the average rent (PWI calculation): £70,140 in London, £42,180 UK-wide, £23,700 in the North East.
- Propertymark’s August 2026 agent survey: about 10 applicants per available property and an average void of almost four weeks.
What today’s ONS figures show
The Office for National Statistics published its Private rent and house prices, UK: October 2026 bulletin at 9:30am on 21 October 2026. Its Price Index of Private Rents covers all privately rented homes, existing tenancies as well as new lets, so it shows what the whole market is paying, not just this month’s new deals.
The headline 3.8% matches August’s rate. Look back further and the cooling is clear. UK annual rent growth peaked at 9.1% in March 2024, was 5.5% in September 2025 and dipped as low as 3.3% in May and June this year before edging back up.
The picture is very different by area. Scotland’s annual rate has fallen from 3.4% a year ago to 0.7%. London has gone the other way in recent months, from 1.1% in January 2026 to 3.5% now, though that is still far below the 11.5% peak it hit in November 2024.
An industry tracker of agreed rents on new lets also reported rents dipping month-on-month in most regions in September. The ONS index moves more slowly because most of the homes it tracks are not changing hands.
Scope: the ONS figures cover the whole UK. Northern Ireland’s latest data runs to July 2026, and the ONS notes Scotland’s figures have historically relied mainly on advertised new lets, so treat cross-border comparisons with some care.
Rents and the income needed, region by region
Here is every nation and English region from the ONS dataset. The final column is our own calculation: the gross annual household income needed to pass a 30-times-monthly-rent referencing test on the average rent.
| Area | Average monthly rent (Sep 2026) | Annual change | Monthly change | Income needed at 30x (PWI calc) |
|---|---|---|---|---|
| UK (provisional) | £1,406 | +3.8% | +0.4% | £42,180 |
| England | £1,466 | +4.0% | +0.5% | £43,980 |
| London | £2,338 | +3.5% | +0.3% | £70,140 |
| South East | £1,438 | +3.5% | +0.8% | £43,140 |
| East of England | £1,298 | +3.8% | +0.7% | £38,940 |
| South West | £1,251 | +4.2% | +0.5% | £37,530 |
| West Midlands | £983 | +4.4% | +0.1% | £29,490 |
| North West | £975 | +5.7% | +0.6% | £29,250 |
| East Midlands | £928 | +3.8% | +0.6% | £27,840 |
| Yorkshire and The Humber | £869 | +4.8% | +0.4% | £26,070 |
| North East | £790 | +5.3% | +0.2% | £23,700 |
| Wales | £848 | +4.1% | +0.3% | £25,440 |
| Scotland | £1,011 | +0.7% | -0.1% | £30,330 |
| Northern Ireland (July 2026) | £879 | +1.7% | +0.6% | £26,370 |
Source: ONS Price Index of Private Rents, UK: monthly price statistics, published 21 October 2026 (not seasonally adjusted). Income needed is PWI’s calculation at 30 times average monthly rent.
London is out on its own: a tenant there needs nearly three times the income of one in the North East to pass the same test. Outside London and the South East, every English region’s average rent can be passed on less than £39,000 a year.
The fastest growth is now in the cheapest areas. The North West (5.7%), North East (5.3%) and Yorkshire and The Humber (4.8%) are rising faster than London and the South East (3.5%), because there is still room under the income line there.
The affordability ceiling explained
When an agent references a tenant, the key test is usually income. Referencing provider Vouch describes the industry standard as 2.5 times the annual rent (30 times the monthly rent) for a tenant, and 3 times the annual rent (36 times monthly) for a guarantor. It also notes that criteria vary between agents.
Put simply, rent can take no more than 40% of a household’s gross income. Divide your target tenant’s combined gross pay by 30 and you have the most they can pass on. Price above that and you are relying on a guarantor, savings or a lower bar from your agent.
That’s why the ceiling bites hardest where rents are highest. In London, the average rent already demands £70,140. Propertymark’s own Housing Insight Report for August 2026 found about ten applicants per available property, but plenty of interest is no use if few of those applicants pass at your price.
Void or rent cut: the maths
The rule of thumb every landlord should know: each 1% off the rent for a year costs about the same as half a week empty. A year has 52 weeks, and 1% of 12 months’ rent is 0.12 months, or about 0.52 weeks of rent. So a 2% cut costs roughly one week’s void, a 4% cut roughly two.
Propertymark’s August survey put the average void at almost four weeks. On a typical let, that’s already nearly 8% of a year’s rent lost before you count council tax, utilities and re-marketing.
Worked example, North West average (£975 a month): a year’s rent is £11,700, or £225 a week. A 2% cut is £19.50 a month, £234 over the year. If holding firm costs even one extra week empty, you’ve lost £225 before your empty-property costs.
Worked example, London average (£2,338 a month): the income needed is £70,140. A couple earning £68,000 between them pass on up to £2,267. Pricing at £2,338 rules them out unless a guarantor earns 36 times the rent, £84,168. Dropping to £2,267 is a 3.0% cut, about £856 over a year, which is around 1.6 weeks of rent at £540 a week. If the lower price fills the flat two weeks sooner with a tenant who passes cleanly, you come out ahead.
Worked example, Scotland average (£1,011 a month): the income needed is £30,330. A single earner on £29,000 passes on up to £967, which is 4.4% below the average. With Scottish rents flat on the year, landlords there have little growth to fall back on, so who you target matters more than squeezing out an extra £20.
Calculator: affordability ceiling and re-let pricing
Enter your asking rent, your likely tenant household’s gross income and your expected void weeks at each price. The tool shows whether they pass referencing, the highest rent they can pass at, and which price leaves you better off over the first year.
Affordability ceiling and re-let pricing
Guide only, not financial advice. Year-one figures are 12 months of rent less void weeks and running costs while empty. Area averages are ONS figures across all private tenancies; new-let rents in your street may differ. Referencing criteria vary between agents and referencing firms.
What to do now if you have a let coming up
- Get agreed-rent evidence. Ask your agent for rents actually agreed (not asking rents) on comparable homes in the last six to eight weeks. Autumn listings priced in the summer may already be stale.
- Define your tenant. Decide on the realistic household (single earner, couple, sharers) and their likely combined gross income. Divide by 30 to find the rent they can pass at.
- Price to the ceiling, not over it. If your rent is just above what your target household can pass, a small cut can widen the pool far more than its cost suggests. Run both prices through the calculator above.
- Put a number on a void week. Weekly rent is monthly rent times 12, divided by 52. Add the council tax, utilities and insurance you carry while empty. That’s what each week of holding out costs.
- Set a review date. Agree with your agent in advance what reduction you’ll make if there’s no suitable applicant after two weeks. Don’t let it drift.
- Value your sitting tenants. With growth slowing, a reliable tenant who stays may be worth more than a few pounds extra from a new one. Weigh any increase against the cost of a void and re-let.
- Three or more comparable agreed rents from the last two months
- Target tenant household and likely gross income written down
- Maximum rent at 30x (and 36x for a guarantor) worked out
- Weekly rent and weekly empty-property costs calculated
- Price-review date agreed with your agent
- Renewal offer for any sitting tenant checked against re-let costs
FAQ
Are UK rents still going up?
Yes, but more slowly. The ONS says UK private rents rose 3.8% in the year to September 2026, to £1,406 a month, compared with 5.5% a year earlier and a peak of 9.1% in March 2024. Scotland is almost flat at 0.7%.
What salary do you need to rent in London?
At the common referencing test of 30 times the monthly rent, a household needs £70,140 a year to rent at the ONS London average of £2,338. That’s our calculation; individual agents may use different multiples.
How do letting agents check if a tenant can afford the rent?
Most use an income multiple. A widely used standard is gross annual income of at least 30 times the monthly rent for the tenant, or 36 times for a guarantor. Joint tenants’ incomes are usually combined, but each agent and referencing firm sets its own rules.
Should I cut the rent or wait for the right tenant?
Compare the two. Each 1% off the rent for a year costs about half a week’s rent. If a modest cut is likely to fill the property a week or more sooner, or brings in tenants who pass referencing cleanly, it often pays. Use the calculator above with your own figures.
Where are rents rising fastest?
In England, the North West at 5.7% a year, followed by the North East at 5.3%. Wales is up 4.1%. The slowest are Scotland (0.7%), Northern Ireland (1.7%, to July 2026), and London and the South East (both 3.5%).
Which region has the cheapest rents?
The North East, at an average of £790 a month, the lowest of the English regions. Wales averages £848. At 30 times the monthly rent, the North East average needs a household income of £23,700.
- ONS: Private rent and house prices, UK: October 2026
- ONS: Price Index of Private Rents, UK: monthly price statistics (21 October 2026 edition)
- Propertymark: Housing Insight Report, August 2026
- Vouch: tenant and guarantor affordability criteria
This article is news and general guidance, not financial, legal or tax advice.