Flat landlords’ 26% real-terms loss: flats up just 5% in 10 years
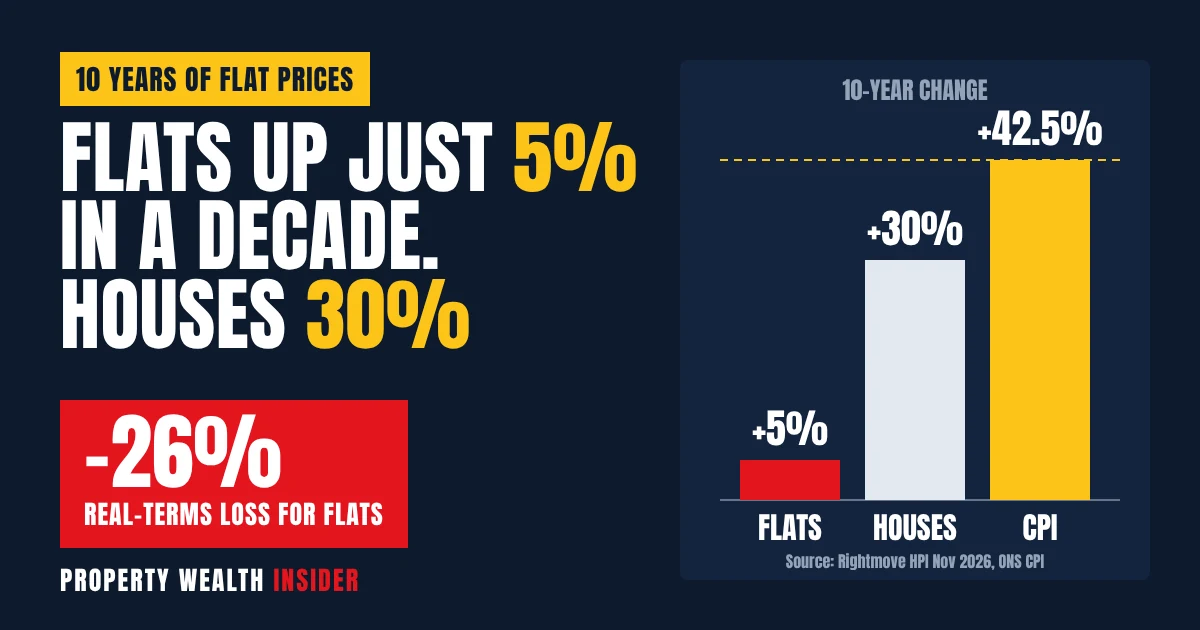
Flat asking prices across Great Britain are up just 5% in ten years, while houses have risen 30%, according to Rightmove’s November 2026 House Price Index, published today (16 November 2026). Over roughly the same decade, consumer prices rose 42.5%, which means the typical flat has lost around a quarter of its value in real terms.
The gap is still widening. Rightmove says flat asking prices are down 1.7% on a year ago, while houses are up 0.1%. Flats also take longer to sell and are more likely to need a price cut.
If you own buy-to-let flats, or are deciding whether to buy, sell or hold one, this is the number that matters: not whether your flat is “up”, but whether it has kept pace with the cost of living. For most flats over the last ten years, it has not.
Key facts
- Flat asking prices are up only 5% over ten years, against 30% for houses (Rightmove, Great Britain).
- CPI inflation rose 42.5% between September 2016 and September 2026 (ONS series D7BT), so flats are down about 26% in real terms, and houses about 9%.
- Flat asking prices are down 1.7% on a year ago, while houses are up 0.1%.
- Flats take 79 days to find a buyer, compared with 68 days for houses, and 37% of flat listings have had a price cut, compared with 34% of houses.
- Land Registry sold prices show the same picture: UK flats are up 18.3% since August 2016, against 39-45% for detached, semi-detached and terraced homes.
The decade gap: flats vs houses vs inflation
Rightmove’s ten-year figures cover a period that included Brexit and the pandemic. Over that time, average asking prices for flats rose 5% and houses rose 30%.
To measure the real-terms change, we used the ONS consumer prices index (CPI, series D7BT). It rose from 101.1 in September 2016 to 144.1 in September 2026, the latest month published. That is an increase of 42.5%, or about 3.6% a year.
Divide each price change by inflation and you get the real result. A flat now buys about 26% less than it did ten years ago, and a house about 9% less. Rightmove does not give the exact start month for its decade figure, so treat these as close approximations.
| £200,000 bought ten years ago | Flat (+5%) | House (+30%) |
|---|---|---|
| Asking-price value today | £210,000 | £260,000 |
| Value needed to keep pace with CPI (+42.5%) | £285,064 | £285,064 |
| Shortfall against inflation | £75,064 | £25,064 |
| Value today in 2016 money | £147,335 | £182,415 |
| Real-terms change | -26.3% | -8.8% |
| Annual growth rate (nominal) | 0.49% | 2.66% |
Put simply, a landlord who put £200,000 into a flat in 2016 would have £10,000 more on paper. But they would need £285,064 just to stand still against inflation. The same money in a typical house would have fallen short by about a third as much.
Rent has been the flat investor’s saving grace. The capital side of the deal has done very little work, so rental income has had to do nearly all of it.
What Land Registry sold prices show
Rightmove tracks asking prices when homes first come to market. As a cross-check, we compared the official UK House Price Index from HM Land Registry and the ONS, which is based on completed sales across the whole UK.
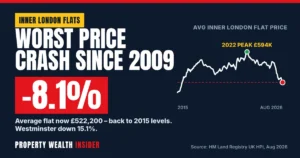
The latest release, for August 2026, puts the average UK flat or maisonette at £194,148. That is down 1.6% on a year earlier, and it is the only property type that has fallen. Every type of house rose.
| Property type (UK) | Aug 2016 | Aug 2026 | 10-year change | Real terms (vs CPI +42.3%) | Annual change |
|---|---|---|---|---|---|
| Flat or maisonette | £164,138 | £194,148 | +18.3% | -16.9% | -1.6% |
| Terraced | £161,779 | £232,505 | +43.7% | +1.0% | +1.8% |
| Semi-detached | £191,823 | £278,675 | +45.3% | +2.1% | +2.1% |
| Detached | £319,156 | £443,846 | +39.1% | -2.3% | +0.7% |
| All property types | £198,186 | £273,037 | +37.8% | -3.2% | +0.9% |
On sold prices, terraced and semi-detached houses roughly kept pace with inflation over the decade, while flats fell about 17% behind. The measures differ, but both point the same way: flats have been the weakest part of the market for ten years.
Figures for the most recent 12 months are provisional and can be revised. The September 2026 UK HPI is due on Wednesday 18 November 2026.
This month’s market: price cuts and slower sales
Across all property types, the average price of homes newly listed on Rightmove fell 1.8% (£6,745) this month to £364,270. That is a bigger fall than the ten-year November average of 1.1%. Asking prices are now 0.2% below a year ago.
Rightmove links the weakness to mortgage costs. It puts the average two-year fixed rate at 5.51%, up from 4.25% earlier in the year. The number of homes for sale is at a 12-year high, and sales agreed are down 7% on last year.
| Rightmove, November 2026 | Flats | Houses |
|---|---|---|
| Annual asking-price change | -1.7% | +0.1% |
| Ten-year asking-price change | +5% | +30% |
| Average days to find a buyer | 79 | 68 |
| Listings with a price reduction | 37% | 34% |
Pricing matters. Rightmove found that homes that needed no price cut found a buyer in 39 days on average, against 119 days for homes that were reduced. If you are selling a flat, an over-ambitious first price can cost you months.
Why flats are lagging
Rightmove’s own explanation is that some buyers have been put off flats by high service charges, rising ground rents, complicated leases and building safety concerns. Those costs and risks fall on the owner, whether that owner lives in the flat or lets it out.
- Service charges are paid every year whatever the market does. They reduce net yield and make a flat cost more to hold than a house of the same price.
- Ground rent clauses that rise over time can put off buyers and some lenders.
- Leasehold complexity: short leases, lease extensions and restrictive terms all add legal cost and slow sales down.
- Building safety: since the Grenfell fire, questions about cladding and fire safety can delay sales and mortgage offers for flats in affected buildings. Lenders may ask for evidence such as an EWS1 form.
Not every flat is affected equally. A long lease, a modest service charge and a clean building safety record make a flat far easier to sell than one with problems on any of these.
Leasehold reform: what is in force and what is not
The Leasehold and Freehold Reform Act 2024 is being brought in gradually. Most of it applies to England and Wales. Here is the position according to legislation.gov.uk as at mid-November 2026.
| Measure | Status |
|---|---|
| Building safety remediation orders and costs (ss.114-116) | In force since 31 October 2024 |
| Removal of the two-year ownership wait before a lease extension or freehold purchase (s.27) | In force since 31 January 2025 |
| Right to manage changes (ss.49-52) and some limits on landlord costs (s.64, partly) | In force since 3 March 2025 |
| Service charge transparency: notice of future demands, insurance cost limits and information, administration charge schedules, limits on litigation costs (England) | Phased in. Some powers from 6 November 2026 (several only so regulations can be made), with further stages on 1 April 2027, 1 November 2027 and 1 November 2028 |
| New valuation rules for lease extensions and freehold purchases, including scrapping marriage value | Not yet in force |
| Ban on new leasehold houses (Part 1) | Not yet in force |
| £250 ground rent cap, falling to a peppercorn after 40 years | Proposed only, in the draft Commonhold and Leasehold Reform Bill (January 2026). The government said it could come into force in late 2028 |
The service charge timetable is set by SI 2026/1128, which applies to England only. The ground rent cap was announced by the government on 27 January 2026 and would cover England and Wales, but it is not law yet. Do not price a flat on the assumption that it will happen.
Calculator: flat vs house real return
Enter your own figures to see what a flat is worth in today’s money once you allow for inflation and service charges. The growth rates are pre-filled with Rightmove’s decade figures converted to annual rates (flats 0.49%, houses 2.66%), and inflation with the ONS CPI decade average of 3.6%.
Flat vs house: real return calculator
This is a guide, not advice. It assumes rent and service charges rise with inflation each year. It does not include mortgage costs, tax, letting fees, maintenance, voids or buying and selling costs. “Today’s money” means the end value divided by cumulative inflation.
Worked example, using the defaults: a £200,000 flat held for ten years at 0.49% growth is worth about £210,019. At 3.6% inflation, that is £147,455 in today’s money, a real loss of £52,545. Net rent after charges comes to about £117,858, with £23,572 paid in service charges and ground rent along the way. Rent is what makes this investment work.
What flat landlords should do now
- Work out your real return. Use the calculator with your actual purchase price and year. Compare the result with what the same money would have earned elsewhere.
- Get your lease facts together. Find out the years left on the lease, the ground rent and any review clause, and the last three years’ service charge accounts. These are what a buyer’s solicitor will ask for.
- Check the building’s safety status. Ask the managing agent about any outstanding fire-safety or cladding work, and whether there is paperwork (such as an EWS1 form) that lenders might ask for.
- Consider a lease extension before you sell. The two-year ownership wait has gone, so you can claim now. The cheaper valuation rules are not yet in force, so get a professional valuation and weigh the cost of acting now against waiting.
- If you are selling, price it right first time. Flats take 79 days to sell on average, and reduced homes take far longer than those priced right from the start.
- If you are holding, focus on yield. With little capital growth, net rent is your return. Challenge service charge budgets and use your rights to information.
- Purchase price, date and current valuation written down
- Lease length remaining and ground rent terms checked
- Last three years’ service charge accounts and current budget obtained
- Building safety and cladding status confirmed with the managing agent
- Lease extension quote considered
- Real return calculated against inflation and against a house
- Asking price set from recent comparable sold flats, not hopes
FAQ
Are flat prices falling in the UK?
Yes. Rightmove says flat asking prices across Great Britain are down 1.7% on a year ago. The official UK HPI shows the average flat or maisonette sold for £194,148 in August 2026, down 1.6% on a year earlier.
How much have flats gone up in the last 10 years?
Rightmove puts the rise in asking prices at 5%, against 30% for houses. Land Registry sold prices show UK flats up 18.3% between August 2016 and August 2026. Both are well below CPI inflation of about 42%.
Is it still worth buying a flat as a buy-to-let?
It can be, but the case rests on rental yield, not capital growth. Check net yield after service charges and ground rent, the length of the lease and the building’s safety status before you commit.
Has the leasehold ground rent cap come in yet?
No. The £250 cap is in the draft Commonhold and Leasehold Reform Bill published in January 2026. It is not law, and the government has said it could come into force in late 2028.
Why do flats take longer to sell than houses?
Rightmove puts it down to high service charges, rising ground rents, complicated leases and building safety concerns putting some buyers off. On average, flats take 79 days to find a buyer, compared with 68 days for houses.
- Rightmove House Price Index, 16 November 2026 (PDF)
- Rightmove House Price Index news release
- ONS: CPI index 00, all items (D7BT)
- UK House Price Index summary: August 2026 (gov.uk)
- HM Land Registry UK HPI data (August 2016 and August 2026 averages by property type)
- Leasehold and Freehold Reform Act 2024 (legislation.gov.uk)
- SI 2026/1128: Commencement No. 4 (England) Regulations 2026
- Gov.uk: ground rents to be capped at £250 (27 January 2026)
This article is news and general guidance, not financial, legal or tax advice.