Rents Rising 4x Faster Than House Prices: 3.8% vs 0.9%
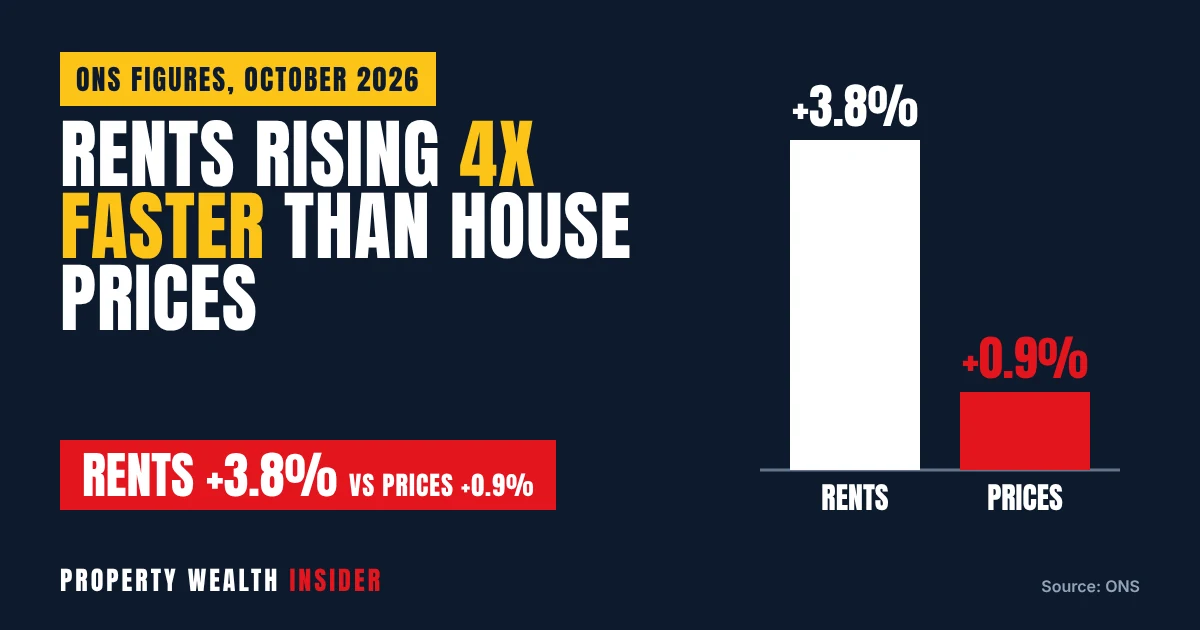
Private rents across the UK are still rising more than four times as fast as house prices. Official figures from the Office for National Statistics (ONS), published on 21 October 2026, put the average UK private rent at £1,406 a month, up 3.8% in the 12 months to September 2026. The average house price rose just 0.9% to £273,000 in the 12 months to August 2026.
Both rates are cooling. Rent growth held at 3.8%, the same as August, but house price growth has now slowed for four months in a row. Scotland stands out: rents there rose only 0.7%, the lowest annual rate since the ONS series began in January 2016.
For landlords and investors, that gap shapes where returns come from. In London and the South East, rent is doing all the work while prices fall. In Scotland, Wales and the North East, capital growth is doing more of it. Here is what the new figures mean for your yield, your next rent review and your total return.
Key facts
- UK average private rent: £1,406 a month, up 3.8% in the 12 months to September 2026, unchanged from August.
- UK average house price: £273,000, up 0.9% in the 12 months to August 2026 (provisional), down from a revised 1.2% in July.
- Scotland rents rose just 0.7% to £1,011, the lowest annual rate since the series began in January 2016.
- North West rents grew fastest in England at 5.7%. London and the South East were slowest at 3.5%.
- London house prices fell 2.2% over the year to August 2026, and South East prices fell 0.8%.
The headline ONS figures, nation by nation
The ONS release brings together its Price Index of Private Rents (PIPR) and the UK House Price Index. The two cover different periods. Rents run to September 2026, prices run to August 2026, and Northern Ireland lags on both.
| Nation | Average monthly rent | Annual rent growth | Average house price | Annual price growth |
|---|---|---|---|---|
| UK | £1,406 | 3.8% | £273,000 | 0.9% |
| England | £1,466 | 4.0% | £294,000 | 0.4% |
| Wales | £848 | 4.1% | £216,000 | 3.1% |
| Scotland | £1,011 | 0.7% | £198,000 | 2.9% |
| Northern Ireland | £879 (July 2026) | 1.7% | £202,000 (Q2 2026) | 9.2% |
In cash terms, the average English rent rose by £56 a month over the year, the Welsh rent by £33 and the Scottish rent by just £7. Welsh rent growth eased to 4.1% from 4.3% in August, well below its most recent peak of 8.9% in March 2025.
Scotland is the only nation where house prices are rising faster than rents. Northern Ireland is the outlier the other way: prices there jumped 9.2% in the year to the second quarter of 2026, the highest rate since late 2022.
Rents vs prices in every English region
Rents grew faster than prices in every English region. The gap is widest in London, where rents rose 3.5% while prices fell 2.2%, a swing of 5.7 percentage points. It is narrowest in the North East, where rents rose 5.3% and prices rose 3.2%.
The table below adds an indicative gross yield for each region. It divides a year of the regional average rent by the regional average house price.
| Region | Avg rent (Sep 2026) | Rent growth | Avg price (Aug 2026) | Price growth | Indicative gross yield |
|---|---|---|---|---|---|
| North East | £790 | 5.3% | £165,640 | 3.2% | 5.7% |
| North West | £975 | 5.7% | £220,393 | 2.2% | 5.3% |
| Yorkshire and The Humber | £869 | 4.8% | £209,266 | 1.8% | 5.0% |
| East Midlands | £928 | 3.8% | £241,955 | 0.5% | 4.6% |
| West Midlands | £983 | 4.4% | £250,731 | 1.2% | 4.7% |
| East of England | £1,298 | 3.8% | £337,848 | 0.2% | 4.6% |
| London | £2,338 | 3.5% | £554,430 | -2.2% | 5.1% |
| South East | £1,438 | 3.5% | £379,953 | -0.8% | 4.5% |
| South West | £1,251 | 4.2% | £304,139 | 0.0% | 4.9% |
The yield column is a rough comparison, not a deal-level yield. Average rents cover all private lets, while average prices cover all homes sold, including larger family houses that are rarely let. Your own yield depends on the property you actually buy.
London prices are recovering from their low point but remain under pressure. The ONS says the average London price is £15,000 below its July 2025 peak of £569,000. London flats fell 5.0% over the year, while London houses rose.
What the gap means for yields and total returns
When rents rise faster than prices, gross yields drift up. That helps landlords buying now, because each pound of purchase price buys more rent. But yield is only half the story. Your total return is rental income plus any change in the property’s value.
Worked example 1: North West. Take a property at the regional average of £220,393 let at £975 a month. That is £11,700 a year, a gross yield of 5.3%. If rent rises in line with the region’s 5.7%, next year’s rent is about £12,367, an extra £667. If the value rises 2.2%, that adds about £4,849. Gross total return: around 7.8% of the property’s value.
Worked example 2: London. A property at £554,430 let at £2,338 a month earns £28,056 a year, a 5.1% gross yield. Rent growth of 3.5% adds about £982 next year. But a 2.2% fall in value knocks off about £12,197. Gross total return falls to around 3.0%.
Worked example 3: Scotland. At £198,397 and £1,011 a month, the gross yield is 6.1%. Rent growth of 0.7% adds only about £85 a year, but 2.9% price growth adds about £5,754. Here, capital growth is carrying almost all of the increase.
These are gross figures. They take no account of mortgage interest, letting fees, repairs, voids, insurance or tax. Each one assumes the last 12 months repeat, which the ONS figures do not predict.
Rent vs price: your total return checker
Pick a region to load the latest ONS averages, or type in your own rent and value. The checker shows your gross yield, what you would gain in rent next year if your rent tracks the regional trend, the capital change if your value tracks regional prices, and your total return before and after running costs.
Rent vs price: your total return checker
Guide only, not financial advice. Regional figures are ONS averages from the October 2026 release (rents to September 2026, prices to August 2026) and assume the last 12 months repeat. Total return excludes mortgage costs and tax. Check your own figures before making decisions.
Rent reviews: the rules in England now
If you let in England and plan to pass on a rise in line with your region, the process changed on 1 May 2026, when the Renters’ Rights Act reforms came into effect. These rules apply to England only. Wales, Scotland and Northern Ireland have their own rules.
- Section 13 for every increase. Rent rises must go through the section 13 process, even when the tenant has already agreed to the increase.
- Form 4A. Use Form 4A, “Landlord’s notice proposing a new rent”, and give it at least two months before the new rent starts.
- Once a year. You can increase the rent only once a year, and not in the first year of the tenancy.
- Market rent challenge. A tenant who thinks the new rent is above open market rent can ask the First-tier Tribunal to set it.
- Rent review clauses. Under government guidance, an increase agreed before 1 May 2026 that takes effect after that date will not apply. Form 4 notices given before 1 May 2026 still stand.
Worked example: an East Midlands tenant pays £1,200 a month. A rise in line with the region’s 3.8% takes it to £1,245.60, an extra £45.60 a month or £547 a year. Serve Form 4A by early January and the new rent can start in early March. Because the ONS figure is a regional average, keep local comparable listings on file in case the tenant challenges the rise as above market rent.
The cooling trend matters here. With national rent growth at 3.8% and easing in several regions, a rise far above your local trend is more likely to look above market and draw a challenge. In Scotland, the 0.7% national figure suggests there is little room for big increases at all.
What to do now: a step-by-step guide
- Benchmark your rent. Compare what you charge with your regional average and annual growth in the tables above. If you are well below, a rise is easier to justify.
- Run your numbers. Put each property through the checker using its real rent and a realistic value. Set the running costs to match your actual spending.
- Separate income from capital. In London and the South East, your return currently depends on rent. Make sure the rent covers your mortgage and costs without relying on price growth.
- Plan rent reviews on the calendar. In England, diary each tenancy’s anniversary, allow two months’ notice, and serve Form 4A in good time.
- Gather market evidence. Save three to five comparable local listings for every proposed rise in case it goes to the tribunal.
- Look at where the yield is. If you are buying, the North East and North West show the highest indicative gross yields among English regions, and prices there are still rising.
- Watch the next release. The ONS publishes its next update on 18 November 2026.
- Current rent compared with the ONS regional average
- Gross yield and total return checked for each property
- Tenancy anniversary dates recorded
- Form 4A served at least two months before any increase (England)
- No more than one rent increase a year (England)
- Comparable local listings saved as evidence
- Running costs, voids and mortgage costs included in your numbers
FAQ
What is the average private rent in the UK in 2026?
The ONS puts the average UK private rent at £1,406 a month in September 2026, up 3.8% on a year earlier. In England it is £1,466, in Wales £848, in Scotland £1,011 and in Northern Ireland £879 (July 2026).
Are rents still going up faster than house prices?
Yes across the UK as a whole. Rents rose 3.8% in the year to September 2026, while house prices rose 0.9% in the year to August 2026. Scotland and Northern Ireland are the exceptions, with prices rising faster than rents.
Where are rents rising fastest?
In England, the North West had the strongest annual rent growth at 5.7%. Wales, at 4.1%, was the fastest of the four nations. London and the South East had the slowest growth among English regions, both at 3.5%.
How do I work out my total return on a rental property?
Add a year’s rental income to the change in the property’s value, take off your running costs, and divide by the property’s value. Our checker above does this using the latest ONS regional trends or your own figures.
How often can I put the rent up in England?
Since 1 May 2026, once a year, using the section 13 process and Form 4A with at least two months’ notice. Tenants can ask the First-tier Tribunal to decide if they think the new rent is above market rent.
Why are Scottish rents barely rising?
The ONS does not give a reason. It reports that Scottish rents rose 0.7% in the year to September 2026, down from 1.1% in August and the lowest annual rate since its series began in January 2016.
Sources
- ONS: Private rent and house prices, UK: October 2026
- ONS: Price Index of Private Rents, UK: monthly price statistics (21 October 2026 edition)
- ONS: UK House Price Index: monthly price statistics (21 October 2026 edition)
- GOV.UK: Renting out your property, rent increases
- GOV.UK: Renters’ Rights Act, an overview for landlords
This article is news and general guidance only. It is not financial, legal or tax advice.