Landlord yields hit 7.9% – but what do you really keep?
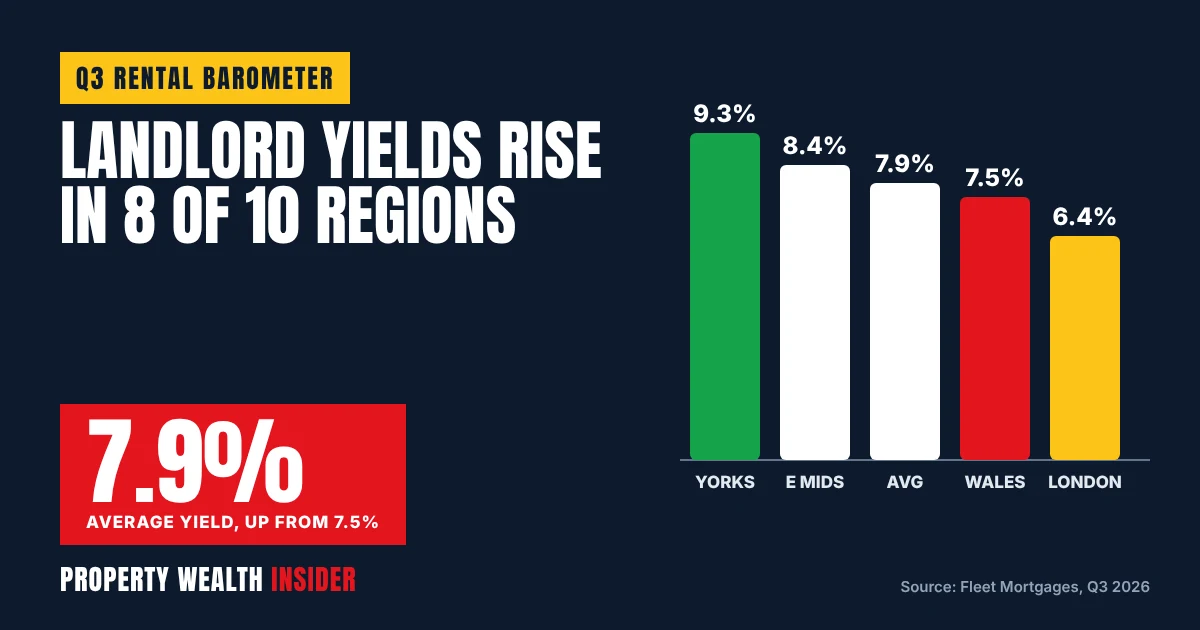
Buy-to-let yields have risen again. Specialist lender Fleet Mortgages says the average rental yield on its landlord applications across England and Wales hit 7.9% in the third quarter of 2026, up from 7.5% a year earlier. Yields went up in eight of its ten regions.
Yorkshire and Humberside is now top of the table at 9.3%, ahead of the North East. Greater London is still last at 6.4%, even though average rents on Fleet’s London applications went past £2,500 a month.
A headline yield is not what lands in your bank account, though. Below we cover what the figures show, what they don’t show, and how to turn a gross yield into a net return after costs and mortgage interest. There is also a calculator that benchmarks your deal against Fleet’s regional average.
Key facts
- Fleet’s average England & Wales rental yield: 7.9% in Q3 2026, up from 7.5% in Q3 2025.
- Highest region: Yorkshire & Humberside at 9.3% (8.2% a year ago). Lowest: Greater London at 6.4%.
- Only the North West (8.3%) and Wales (7.5%) had lower yields than a year earlier.
- Average Fleet London rent: £2,597 a month, up from £2,364 in Q2.
- Average Fleet borrower now owns 18 properties (12 a year ago). Bank Rate is 3.75%, with the next decision on 5 November 2026.
Where yields rose and where they fell
Fleet’s Q3 2026 Rental Barometer came out on 5 October. It splits England and Wales into ten regions. The biggest annual jump was in Yorkshire and Humberside, up 1.1 percentage points. The East Midlands rose 0.9 points, and the West Midlands and South East each rose 0.7.
Wales fell furthest, from 8.2% to 7.5%. The North West slipped from 8.5% to 8.3%. On a quarterly basis, East Anglia, the North West and Wales were down, and the North East was flat at 9.2% for a second quarter running.
| Region | Q3 2025 | Q2 2026 | Q3 2026 | Change on year |
|---|---|---|---|---|
| Yorkshire & Humberside | 8.2% | 8.7% | 9.3% | +1.1 pts |
| North East | 9.0% | 9.2% | 9.2% | +0.2 pts |
| East Midlands | 7.5% | 8.1% | 8.4% | +0.9 pts |
| North West | 8.5% | 8.8% | 8.3% | -0.2 pts |
| West Midlands | 7.5% | 8.0% | 8.2% | +0.7 pts |
| Wales | 8.2% | 8.1% | 7.5% | -0.7 pts |
| South East | 6.5% | 6.9% | 7.2% | +0.7 pts |
| South West | 7.0% | 6.6% | 7.1% | +0.1 pts |
| East Anglia | 6.6% | 7.1% | 7.0% | +0.4 pts |
| Greater London | 5.9% | 6.3% | 6.4% | +0.5 pts |
| England & Wales | 7.5% | n/a | 7.9% | +0.4 pts |
The rents behind the yields
Fleet also publishes the average monthly rent on its applications. These figures swing a lot from one quarter to the next, because each quarter covers a different set of properties.
| Region | Q3 2025 | Q2 2026 | Q3 2026 | Change on year |
|---|---|---|---|---|
| Greater London | £2,165 | £2,364 | £2,597 | +20.0% |
| East Anglia | £1,501 | £1,515 | £1,912 | +27.4% |
| South East | £1,662 | £1,628 | £1,611 | -3.1% |
| West Midlands | £1,563 | £1,370 | £1,504 | -3.8% |
| South West | £1,512 | £1,423 | £1,494 | -1.2% |
| East Midlands | £1,125 | £1,353 | £1,355 | +20.4% |
| North West | £1,157 | £1,188 | £1,355 | +17.1% |
| Yorkshire & Humberside | £1,079 | £1,064 | £1,249 | +15.8% |
| Wales | £980 | £1,214 | £1,079 | +10.1% |
| North East | £848 | £844 | £792 | -6.6% |
Compare those changes with the official numbers. The ONS Price Index of Private Rents puts the average UK private rent at £1,400 a month, up 3.8% in the 12 months to August 2026. In England it is £1,459 (up 4.0%), and in London £2,332 (up 3.5%). The next ONS update is due on 21 October 2026.
So the 20% annual rise in Fleet’s London figure is not London rent inflation. It says more about which properties Fleet’s borrowers were financing that quarter: bigger, pricier or differently located homes.
Why this is a lender’s sample, not a national figure
Fleet’s barometer is built from Fleet’s own mortgage applications. It is not an official statistic and doesn’t describe every rental property. Keep three things in mind:
- Who borrows from Fleet. Fleet is a specialist buy-to-let lender, and most of its applications come from portfolio landlords. In Q3, 71% came through limited companies. Higher-yielding stock, such as HMOs and multi-unit blocks, may be over-represented compared with the typical rental home.
- It moves with the mix. A few large deals in one region can shift its average from one quarter to the next. That is why the South West went from 7.8% in Q1 to 6.6% in Q2 and back up to 7.1% in Q3.
- It is a gross figure. The barometer doesn’t publish its method. Yields of this kind compare annual rent with property value before any costs. Treat them as gross yields.
It is still useful. It shows what deals landlords are actually putting in front of a lender right now. Use it as a benchmark for your own figures, not as a valuation.
Gross yield vs net yield: what you actually keep
Gross yield = annual rent ÷ property value × 100. It is quick to work out and useful for comparing areas, but it ignores every cost.
Net yield = (annual rent received − running costs) ÷ property value × 100. Running costs include letting or management fees, insurance, maintenance, safety certificates and void periods. Mortgage interest is left out, so you can compare properties regardless of how they are financed.
Cash-on-cash return = annual profit after mortgage interest ÷ the cash you put in × 100. This is the figure that shows what your deposit is earning, before tax.
Worked example 1: Yorkshire & Humberside. Take Fleet’s Q3 average rent of £1,249 a month (£14,988 a year). A 9.3% gross yield implies a value of about £161,000. Assume two weeks of voids, 12% management, £400 insurance, £1,200 maintenance and £600 for compliance and sundries. Rent received is about £14,412 and costs are £3,929, which leaves £10,482. That is a net yield of 6.5%. Add a 75% interest-only mortgage (£120,750) at 5.17%, Fleet’s average five-year fixed rate, and interest comes to £6,243. Pre-tax profit is £4,239, or 10.5% cash-on-cash on a £40,250 deposit.
Worked example 2: Greater London. At £2,597 a month (£31,164 a year) and 6.4% gross, the implied value is about £487,000. Assume two weeks of voids, 12% management, £600 insurance, £2,400 maintenance and £900 sundries. That leaves £22,470, a net yield of 4.6%. A 75% mortgage of £365,250 at 5.17% costs £18,883 a year. Profit is £3,586, just 2.9% cash-on-cash on a £121,750 deposit.
Rate stress test: if the mortgage rate rose to 6%, the London example’s profit would fall to about £555 a year. The Yorkshire example would still make about £3,237. Mortgage debt is much larger relative to the rent in low-yield areas, so a rate rise hits them harder. These examples use regional averages from different properties and leave out purchase costs and tax.
Tax depends on how you own the property. If you own it personally, you can’t deduct mortgage interest as an expense. Instead you get a basic-rate tax reduction, under rules fully in place since April 2020. A higher-rate taxpayer’s after-tax return can therefore be much lower than the pre-tax figures above. Ask an accountant to model your own position.
Calculator: your yield against the regional benchmark
Pick a region to load Fleet’s Q3 2026 average yield as a benchmark, then enter your own figures. Mortgage interest is worked out on an interest-only basis.
Rental yield & net return calculator
A guide only, not financial advice. Benchmarks are Fleet Mortgages’ Q3 2026 average gross yields on its own applications, not official statistics. Results are before tax and assume an interest-only mortgage.
Mortgage rates and rental cover
Rising yields help, but borrowing costs went up too. Fleet’s figures show the market average two-year buy-to-let fix rose from 4.78% in Q2 to 4.89% in Q3, and the five-year average from 5.44% to 5.57%. Fleet’s own average two-year rate rose to 4.61%, while its five-year average fell to 5.17%.
The Bank of England held Bank Rate at 3.75% on 17 September 2026. Fleet’s barometer notes that three members of the Monetary Policy Committee voted to raise it to 4%. The next decision is on 5 November 2026.
Rental cover is the clearest sign of pressure. It measures how far the rent exceeds the mortgage interest. On Fleet’s new applications, average cover at origination fell from 144% in Q2 to 132% in Q3, and it was 171% a year earlier. Many landlords are borrowing close to the limit lenders’ stress tests allow, which leaves less room if costs rise.
Bigger landlords are doing more of the borrowing
The average Fleet borrower now owns 18 investment properties, up from 16 in Q2 and 12 a year ago. Landlords with 15 or more properties made up 30% of applications, compared with 26% in Q2 and 23% a year earlier. Those with one to three properties fell to 24%.
New investors are still coming in, too. First-time landlords made up 10% of applications, up from 9%. Purchases fell slightly to 34% of business, and the limited company share dropped from 78% to 71%.
For smaller landlords, the lesson is that the professionals buying now are judging deals on net return and rental cover, not headline gross yield. You should too.
What to do now
- Work out your real gross yield. Use current rent and a realistic current value, not the price you paid ten years ago.
- Add up last year’s actual costs. Pull 12 months of agent statements, repair invoices, insurance and certificates. Put them into the calculator above.
- Be honest about voids. Count the weeks the property actually stood empty, plus the time taken for cleaning and re-letting.
- Stress-test your mortgage. Rerun the numbers at your current rate plus one percentage point. If profit falls close to zero, plan for remortgaging now, not when the fixed rate ends.
- Benchmark against your region. If your gross yield is well below Fleet’s regional average, look for the reason: rent below market, an overvalued property, or the wrong type of stock.
- Get tax advice before buying or restructuring. Personal and company ownership give very different after-tax returns.
- Current market rent checked against local listings
- Up-to-date valuation or comparable sales
- 12 months of actual running costs totalled
- Void weeks recorded for the last two years
- Mortgage rate, fix end date and rental cover noted
- Net yield and cash-on-cash worked out at today’s rate and at +1 point
- Ownership structure and tax position reviewed with an accountant
FAQ
What is a good rental yield in the UK in 2026?
It depends on the region. Fleet’s Q3 2026 average gross yield was 7.9% across England and Wales, ranging from 6.4% in London to 9.3% in Yorkshire and Humberside. A good deal is one that beats your local benchmark and still makes a profit after costs and mortgage interest.
Which region has the highest buy-to-let yields?
In Fleet’s Q3 2026 data, Yorkshire and Humberside had the highest yield at 9.3%, just ahead of the North East at 9.2%. Greater London was the lowest at 6.4%.
How do I calculate net rental yield?
Take the annual rent you actually receive after voids, subtract running costs (fees, insurance, maintenance, compliance), divide by the property’s value and multiply by 100. Leave mortgage interest out of net yield and include it in your cash-on-cash return.
Is the difference between gross and net yield usually big?
Often, yes. In our worked examples, costs and voids took roughly 1.8 to 2.8 percentage points off the gross yield: London went from 6.4% gross to 4.6% net, and Yorkshire from 9.3% to 6.5%. Leasehold service charges or high maintenance costs can widen the gap further.
Are Fleet Mortgages’ yield figures official statistics?
No. They are based on applications to one specialist lender, mostly from portfolio landlords. For official rent data, use the ONS Price Index of Private Rents, which is published monthly.
- Fleet Mortgages: Rental Barometer Q3 2026 press release (5 October 2026)
- Fleet Mortgages: Rental Barometer Q3 2026 report (PDF)
- ONS: Private rent and house prices, UK, September 2026
- ONS: Private rent and house prices, UK, October 2026 (release calendar)
- Bank of England: Bank Rate
- GOV.UK: Changes to tax relief for residential landlords
This article is news and general guidance only. It is not financial, legal or tax advice.