House prices slump 1.2%: worst annual fall in three years
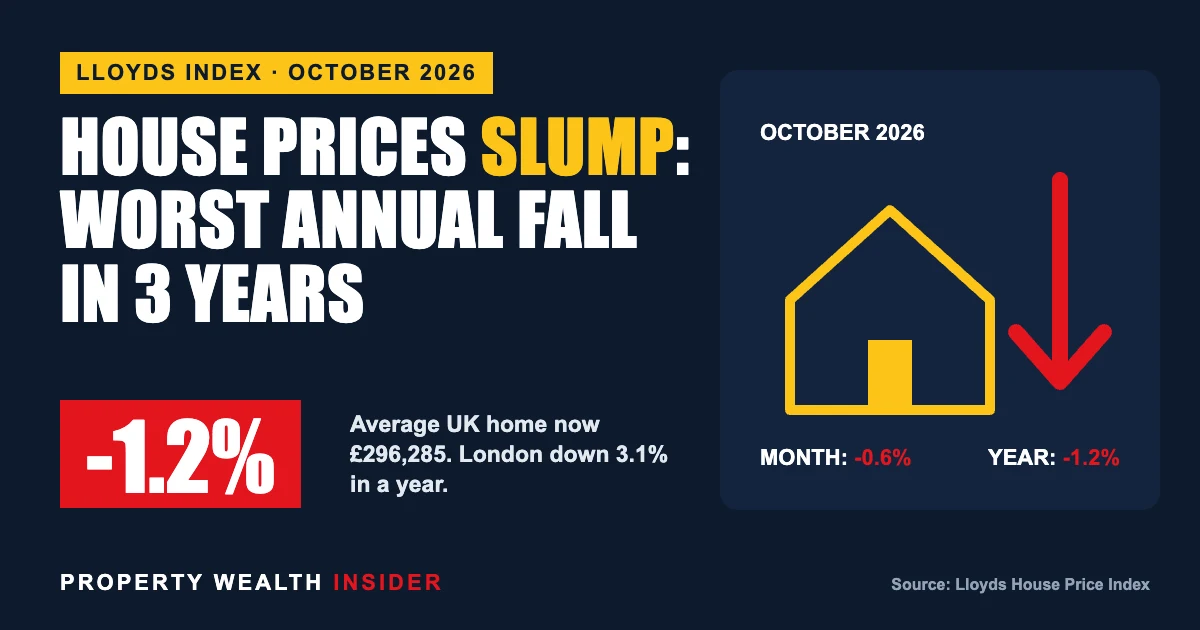
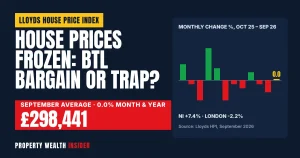
UK house prices fell 0.6% in October, pushing the annual change down to -1.2%. That is the sharpest year-on-year drop since October 2023, according to the Lloyds House Price Index, the long-running series that was called the Halifax index until this summer.
The typical home is now valued at £296,285, which is £1,882 less than in September. The fall comes days after the Bank of England raised Bank Rate to 4%.
For landlords this goes well beyond the headline. Lower values move your loan-to-value (LTV) ratio, and LTV sets the rate you can get when a fixed deal ends. If you’re buying, the same dip improves the yield on a new purchase. Below we cover where prices are falling and rising, what the change does to your LTV, and a calculator to check your own position.
Key facts
- UK house prices fell 0.6% in October 2026 and are down 1.2% on a year earlier, the biggest annual fall since October 2023 (Lloyds HPI).
- The average price is now £296,285, down from £298,167 in September.
- Prices are lowest relative to a year ago in Greater London (-3.1%), the South East (-2.4%) and the South West (-2.4%). Northern Ireland (+4.4%) and Scotland (+2.8%) are still rising.
- Nationwide says prices were flat in October, with annual growth of just 0.5%, its weakest since January 2024.
- The Bank of England raised Bank Rate to 4% on 5 November 2026. Rents are still rising: ONS puts UK private rents up 3.8% a year, to £1,406 a month.
What the October index shows
On the Lloyds index, prices fell 0.6% from September to October, after a 0.1% fall the month before. Over the latest three months they are down 0.5% on the previous three months.
The direction of travel is the bigger worry. This index’s annual figure first turned negative in August (-0.4%), edged back to -0.1% in September and has now dropped to -1.2%.
If you’re wondering where the Halifax index went: it was renamed the Lloyds House Price Index in July 2026. Lloyds says the methodology hasn’t changed and the index already used both Halifax and Lloyds mortgage data. It is owned and administered by S&P Dow Jones Indices and is still the UK’s longest-running monthly house price series, with data going back to January 1983.
Andrew Asaam, Mortgages Director at Lloyds, expects conditions to stay subdued in the near term. He also said Lloyds does not expect a sustained period of falling prices.
Where prices are falling and rising
Prices are moving very differently in different parts of the country. The southern half of England is falling while the devolved nations and the north keep rising. These are the nine nations and regions the October release reports:
| Nation / region | Average price | Annual change |
|---|---|---|
| Northern Ireland | £228,708 | +4.4% |
| Scotland | £222,667 | +2.8% |
| North West | £249,916 | +2.2% |
| North East | £184,318 | +2.0% |
| Wales | £233,116 | +1.6% |
| West Midlands | £261,656 | +0.3% |
| South West | £298,057 | -2.4% |
| South East | £379,258 | -2.4% |
| Greater London | £524,892 | -3.1% |
| UK | £296,285 | -1.2% |
Source: Lloyds HPI, October 2026. Regional annual changes use the latest three months of mortgage approval data, so they are smoother than the monthly UK figure. Northern Ireland still leads but is slowing: its annual growth was +6.9% a month earlier.
For investors this split matters. A London landlord who bought a year ago is probably sitting on a paper loss. A landlord in Belfast, Glasgow or Manchester has probably still gained.
How the other house price indices compare
The Lloyds index is the gloomiest of the three main measures, but all of them point the same way: growth is fading.
| Index | Latest month | Average price | Monthly | Annual |
|---|---|---|---|---|
| Lloyds HPI (ex-Halifax) | October 2026 | £296,285 | -0.6% | -1.2% |
| Nationwide HPI | October 2026 | £273,566 | 0.0% | +0.5% |
| ONS / Land Registry UK HPI | August 2026 (provisional) | £273,000 | +0.3% | +0.9% |
Nationwide says October prices were flat month on month, and annual growth slowed from 0.8% in September to 0.5%, its weakest since January 2024. The official UK HPI from ONS and HM Land Registry runs about two months behind. It shows +0.9% annual growth in August, down from 1.2% in July, with London prices 2.2% lower than a year earlier. September’s official figures are due on 18 November 2026.
Both lender indices are built from their own mortgage lending, so they don’t capture cash purchases. That’s one reason their averages differ from the official figure, which takes a while to catch up. When the lender indices turn, the ONS series usually follows a few months later.
Why prices are slipping: rates and demand
On 5 November 2026 the Bank of England’s Monetary Policy Committee voted 8-1 to raise Bank Rate by 0.25 percentage points, from 3.75% to 4%. One member, Catherine L Mann, voted for a bigger rise to 4.25%.
The Bank’s reasoning is that higher energy prices linked to the Middle East conflict are pushing up inflation. CPI inflation reached 3.5% in September, and Bank staff expect it to peak at about 5% by mid-2027. The MPC says policy is not on a pre-set path.
Demand had already cooled before the rate rise. Figures quoted in the Lloyds release show mortgage approvals fell to 53,443 in September (Bank of England data), 19.4% lower than a year earlier. Residential transactions slipped 0.5% to 94,800 (HMRC, seasonally adjusted, provisional). New buyer enquiries in the RICS survey had a net balance of -22%.
Why it matters for buy-to-let: lenders base their rental stress tests on the product rate. If swap rates and fixed buy-to-let rates rise after the Bank Rate increase, the rent needed to support a given loan goes up at the same moment property values are falling. That can squeeze how much you can borrow from both directions.
What falling values mean for your LTV and remortgage
LTV is your mortgage balance divided by the property’s value. A falling value raises your LTV even if you haven’t borrowed a penny more. Buy-to-let pricing tends to step up at bands such as 60% and 75%, so a small fall can push you into a more expensive tier.
Example 1 (South East): a house valued at £300,000 a year ago with a £222,000 interest-only mortgage was at 74% LTV. The official UK HPI has South East prices down 0.8% over the year to August 2026. Apply that and the index-based value is £297,600, so the LTV rises to 74.6%. That is still under 75%, but another fall of about 0.5% would tip it over.
Example 2 (London): a flat valued at £500,000 a year ago with a £370,000 loan was at 74% LTV. Apply London’s 2.2% annual fall on the official index and the value is £489,000, so the LTV rises to 75.7%. At remortgage, a 75% LTV deal would allow a loan of only £366,750. You would need to repay about £3,250, or accept a higher-LTV product at a worse rate.
Use the calculator to run your own numbers. It uses the official UK House Price Index, which publishes average prices for each nation and English region, to update your valuation from the month it was done to August 2026, the latest month available. It then shows your estimated equity, LTV band and gross yield. The Lloyds figures suggest prices have fallen since August, so use the stress test to allow for that.
What is my property worth now, and what is my LTV?
Guide only, not financial advice. This is an index-based estimate using average prices from the official UK House Price Index (HM Land Registry / ONS, Open Government Licence), August 2025 to August 2026. August 2026 figures are provisional, and Northern Ireland is updated quarterly. The official data runs about two months behind, so use the stress test to allow for any fall since August. A lender’s valuation of your property may differ considerably.
Yields and buying opportunities
There is an upside for investors: rents are still rising while prices go backwards. ONS figures put average UK private rents at £1,406 a month in September 2026, up 3.8% on a year earlier. In England rents are £1,466 (+4.0%), in Wales £848 (+4.1%) and in Scotland £1,011 (+0.7%).
When rents rise and prices fall, gross yields improve. Take the London flat from Example 2, let at £1,850 a month. On a £500,000 valuation it yields 4.44%. On the index-adjusted £489,000 it yields 4.54%, before any rent rise.
Cash-rich buyers and those with low-LTV portfolios may find sellers more willing to negotiate, particularly in the South East, South West and London, where annual falls are steepest. The trade-off is higher borrowing costs, so check the deal works at today’s rates. Don’t buy on the assumption that rates will fall.
- Southern England: prices are falling fastest, so there’s more room to negotiate, but yields start lower.
- North and devolved nations: prices are still rising, average values are lower and yields are often higher, but sellers have less reason to discount.
- Timing: lender indices move first and official data follows, so asking prices may lag the fall for a few months.
What landlords should do now
- List every fixed rate ending in the next 12 months, with the balance and the date of each property’s last valuation.
- Re-estimate values with the calculator above, using your region, and flag anything now within 5% of the 75% LTV line.
- Talk to a broker early. Many lenders let you secure a product months before your current deal ends, which can protect you if rates rise further.
- Check rental stress tests against today’s product rates, not the rate you got last time. Review rents against local market levels.
- Plan for a shortfall: if a property is above 75% LTV, decide now whether you would pay down capital, cross-charge or take a higher-LTV deal.
- If you’re buying, make offers based on yield at today’s borrowing costs and use falling local prices as negotiating evidence.
- Fixed-rate end dates listed for every mortgage
- Index-based value and LTV estimated for each property
- Properties within 5% of the 75% LTV band flagged
- Broker contacted about refinancing options
- Rents reviewed against local market levels
- Rental stress test checked at current product rates
- Cash reserve set aside for any LTV shortfall
FAQs
Are UK house prices falling right now?
On the Lloyds index, yes: down 0.6% in October and 1.2% over the year. Nationwide shows prices flat in October and still up 0.5% on a year earlier, so the picture depends on which index you look at.
What happened to the Halifax house price index?
It became the Lloyds House Price Index in July 2026. The methodology is unchanged and the data goes back to January 1983. S&P Dow Jones Indices owns and administers it.
Where are house prices falling the most?
Greater London (-3.1% annually) has the steepest fall, followed by the South East and South West (both -2.4%). Northern Ireland (+4.4%) and Scotland (+2.8%) have the strongest growth.
Will falling house prices affect my buy-to-let remortgage?
It can. A lower valuation raises your LTV, and if you move above a band such as 75%, you may face a higher rate or need to pay down part of the loan. Check your position before your fixed rate ends.
When is the next house price index released?
Lloyds publishes its November figures at 7am on 7 December 2026. The official ONS UK HPI for September is due on 18 November 2026.
- Lloyds Bank: House Price Index
- Lloyds House Price Index, October 2026 (PDF)
- Nationwide House Price Index, October 2026
- UK House Price Index England: August 2026 (HM Land Registry / ONS)
- UK House Price Index summary: August 2026 (HM Land Registry / ONS)
- ONS: Private rent and house prices, UK: October 2026
- Bank of England: Monetary Policy Summary and minutes, November 2026
This article is news and general guidance only. It is not financial, legal or tax advice.