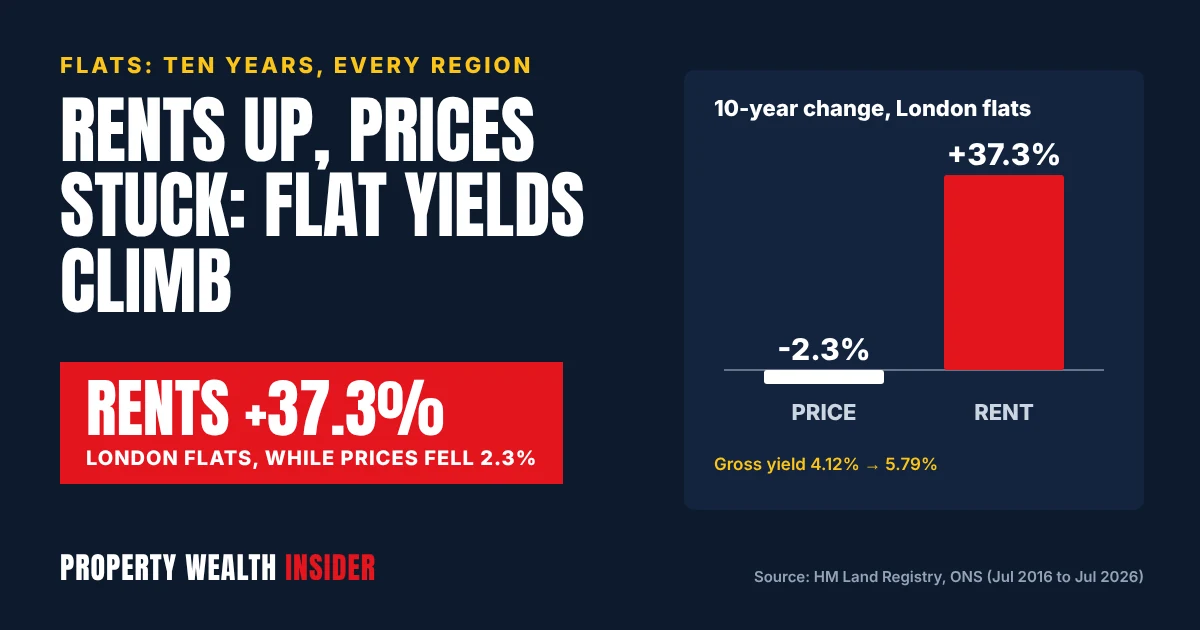
London flat prices fall 2.3% in a decade as rents soar 37%
Flat rents have outrun flat prices in every region of England and Wales over the past ten years. Our analysis of official HM Land Registry and ONS figures shows that the average flat or maisonette rent rose between 37% and 56% from July 2016 to July 2026. Flat purchase prices rose between 8% and 42% over the same period, and in London they fell.
For buy-to-let investors that means rising gross yields on flats almost everywhere. It also means flats have been poor at building capital, which is half of why most people buy property in the first place.
The pattern was recently highlighted in an analysis by Brickview. We could not find Brickview’s own publication, so we went back to the raw data ourselves. Every figure below comes from the official datasets, not from Brickview.
Key facts
- London flat prices fell 2.3% in ten years (to £424,013), while London flat rents rose 37.3% (to £2,045 a month).
- North West flats saw the biggest rise in both: prices +42.1%, rents +56.2%.
- The North East has the highest indicative gross flat yield we calculated: 7.66%, up from 6.52% in 2016.
- Prices (CPI) rose 42.0% over the same ten years, so in real terms London flats have lost about 31% of their value.
- Flat prices in England fell 3.5% in the year to July 2026; across the UK, the average flat rent was £1,367 a month in August 2026.
The numbers: ten years of flat prices and rents
We compared the HM Land Registry UK House Price Index average price for flats and maisonettes with the ONS Price Index of Private Rents (PIPR) average rent for flats and maisonettes, in July 2016 and July 2026. July 2026 is the latest month both datasets cover.
Rents rose faster than prices in all nine English regions and in Wales. The biggest gaps are in the South and East. In the East of England, flat rents rose 48.3% while flat prices rose just 8.8%.
| Region | Avg flat price Jul 2016 | Avg flat price Jul 2026 | Price change | Avg flat rent Jul 2026 | Rent change | Indicative gross yield 2016 → 2026 |
|---|---|---|---|---|---|---|
| North East | £85,066 | £103,288 | +21.4% | £659 | +42.5% | 6.52% → 7.66% |
| North West | £99,024 | £140,666 | +42.1% | £813 | +56.2% | 6.30% → 6.94% |
| Yorkshire and the Humber | £99,818 | £127,578 | +27.8% | £703 | +45.2% | 5.82% → 6.61% |
| East Midlands | £95,750 | £124,624 | +30.2% | £738 | +56.0% | 5.93% → 7.11% |
| West Midlands | £105,302 | £139,370 | +32.4% | £794 | +50.6% | 6.01% → 6.84% |
| East of England | £174,682 | £190,128 | +8.8% | £1,023 | +48.3% | 4.74% → 6.46% |
| London | £433,809 | £424,013 | -2.3% | £2,045 | +37.3% | 4.12% → 5.79% |
| South East | £191,920 | £207,581 | +8.2% | £1,142 | +43.4% | 4.98% → 6.60% |
| South West | £146,520 | £171,240 | +16.9% | £973 | +50.9% | 5.28% → 6.82% |
| Wales | £96,856 | £128,586 | +32.8% | £705 | +50.6% | 5.80% → 6.58% |
How we worked it out: indicative gross yield = ONS average monthly flat rent x 12, divided by the Land Registry average flat price for the same region and month. Rent changes use the ONS PIPR flat index. PIPR covers new and existing tenancies, while the HPI tracks sale prices, so treat these yields as a regional benchmark, not a figure any one flat will achieve. Other analyses using different months or methods will produce different numbers.
Why flat yields are rising
Yield is rent divided by price. When rent climbs and price stands still, yield goes up. That is exactly what happened in London, where the indicative gross flat yield rose from 4.12% to 5.79%, and in the South East (4.98% to 6.60%) and East of England (4.74% to 6.46%).
The trend is still running. In the year to July 2026, Land Registry figures show flat prices fell 6.6% in London and 3.5% across England. Meanwhile the ONS September 2026 bulletin put average UK private rent at £1,400 a month in August, up 3.8% on a year earlier. In England rents were up 4.0% to £1,459 a month, and in London up 3.5% to £2,332. The North East and North West had the fastest rent growth of any English region, at 5.8%.
The next ONS release, covering September rents, is due on 21 October 2026.
The catch: capital growth has gone missing
Higher yields are only half of the story. The ONS consumer prices index (CPI) rose 42.0% between July 2016 and July 2026. Put flat values against that and the picture changes:
- London: a flat bought for £433,809 in 2016 would now need to be worth about £616,000 just to match inflation. The average is £424,013, a real-terms fall of about 31%.
- North West: the best-performing region, at +42.1%, only just kept pace with inflation.
- Rents: UK flat rents rose 42.4% on the ONS index, again almost exactly in line with CPI. Rents kept their real value; flat prices mostly lost it.
So a rising yield on a flat isn’t automatically good news. Part of it comes from rents keeping up with living costs, and part from flats becoming less attractive to buyers. If you’re buying for income, that can be a bargain. If you’re counting on capital growth to fund the next deal, flats have been a weak bet for a decade.
Service charges and ground rent: the yield killers
The headline gross yield ignores the biggest difference between a flat and a house: leasehold costs. Service charge and ground rent come straight off your rent, and they hit cheaper flats hardest.
Worked example: North East vs London. Take the average North East flat (£103,288, £659 a month rent) with an example service charge of £1,200 a year. That takes 15.2% of the £7,908 annual rent. Allow 15% of rent for letting, repairs and voids, and the 7.66% gross yield falls to a 5.35% net yield.
An average London flat (£424,013, £2,045 a month) with a £2,500 service charge loses 10.2% of its rent to the charge. With the same 15% other costs, net yield falls from 5.79% to 4.33%. The service charge is double in pounds but smaller as a share of the rent. In a £100,000 flat, a £500 rise in the service charge cuts your net yield by half a percentage point.
What is changing on leasehold:
- In force: the Leasehold Reform (Ground Rent) Act 2022 ended ground rents on most new residential long leases in England and Wales. Under the Leasehold and Freehold Reform Act 2024, since 31 January 2025 you no longer have to own a flat for two years before you can extend the lease or buy the freehold.
- Not yet in force: most of the 2024 Act, including its service charge transparency reforms. The House of Commons Library says secondary legislation is due in 2026, with implementation “as soon as possible from 2027”.
- Proposed only: the draft Commonhold and Leasehold Reform Bill, published on 27 January 2026, would cap ground rents on existing leases at £250 a year, falling to a peppercorn after 40 years. It is not law yet. The Commons Library says the cap is likely to start in late 2028, subject to Parliament.
If you own a flat with a high or rising ground rent, the proposed cap could improve your net yield and make the flat easier to sell. But don’t price it in until it becomes law.
Mortgages on flats: the rent cover test
Lenders don’t just look at the yield. Under the Prudential Regulation Authority’s buy-to-let underwriting rules (SS13/16), lenders test whether the rent covers the mortgage interest at a stressed rate. The PRA notes that the industry standard minimum interest cover ratio (ICR) is 125%. For loans fixed for under five years, the stress rate is at least 2 percentage points above the pay rate, and never below 5.5%. Loans fixed for five years or more can be tested at the actual rate.
Worked example: an average London flat at £424,013, rented at £2,045 a month, with a 75% loan (£318,010) at an illustrative 5% rate. On a two-year fix, it is stressed at 7%, giving an ICR of just 110%. That fails a 125% test, and the most you could borrow would be about £280,000 (66% LTV). On a five-year fix tested at 5%, the ICR is 154% and it passes.
That is why low-yield flats often push landlords towards longer fixes or bigger deposits. Lenders can also have their own criteria for flats, such as minimum lease length or the type of block. Check these before you offer, not after. A short lease can make a flat hard to mortgage at all, which also limits who can buy it from you later.
Flat yield and cash-flow calculator
Pick a region to load its average flat price and rent, then enter your own figures. Cash flow is shown before tax.
Flat yield and cash-flow calculator
Guide only, not financial advice. The regional defaults are averages from HM Land Registry UK HPI and ONS PIPR (July 2026, provisional). The stress test follows the PRA SS13/16 minimums (125% ICR, stress rate of the pay rate +2 points with a 5.5% floor for fixes under five years); individual lenders may set stricter tests. Figures are before tax.
What to do now
- Benchmark your flats. Compare your rent and value with the regional averages in the table. A yield well below your region’s average is a sign your rent is behind the market.
- Get the real service charge history. Ask for the last three years of service charge accounts and the budget for next year before you buy. Check whether a major works bill is coming up.
- Read the lease. Check the years left, the ground rent and any review clause, and any letting restrictions. Remember that extending a lease no longer needs two years of ownership.
- Stress test before you offer. Run the price, rent and loan through the calculator above at the 5.5%-plus stress rate. If it fails, plan for a bigger deposit or a five-year fix.
- Price your exit. Assume flat values may only keep pace with inflation, or fall in real terms, and decide whether the deal works on income alone.
- Last 3 years of service charge accounts and next year’s budget
- Any major works (section 20) notices issued or planned
- Years left on the lease and ground rent terms
- Lease restrictions on subletting or short lets
- Lender criteria for flats (lease length, block type, floors)
- Stress-tested ICR of at least 125% at the right rate
- Net yield after leasehold costs, letting fees and voids
- Exit plan if the flat’s value only keeps pace with inflation
FAQs
Are flats a good buy-to-let investment in 2026?
For income, the numbers have improved. Indicative gross flat yields rose in every region of England and Wales over ten years. For capital growth, flats have struggled: only North West flats roughly kept pace with inflation, and London flats fell in cash terms.
What is the average rental yield on a flat?
Using July 2026 averages, our indicative gross yields range from 5.79% in London to 7.66% in the North East. Your net yield will be lower once you take off service charge, ground rent, letting fees, repairs and voids.
Why are London flat prices falling?
The data shows the fall but not its causes. Land Registry figures put the average London flat at £424,013 in July 2026, down 6.6% in a year and 2.3% in ten years. The ONS says London house prices have fallen year on year for eleven months in a row.
Will the £250 ground rent cap apply to my buy-to-let flat?
The cap is only a proposal in the draft Commonhold and Leasehold Reform Bill and is not law. It is aimed at existing leaseholders, and the Commons Library says it is likely to start in late 2028, subject to parliamentary approval.
How much can I borrow on a buy-to-let flat?
It mostly depends on the rent. Under PRA rules lenders typically need rent to cover 125% of the interest at a stressed rate of at least 5.5% for fixes under five years. Use the calculator above to see whether your loan passes.
- HM Land Registry: UK House Price Index data downloads, July 2026 (average prices by property type)
- ONS: Price Index of Private Rents, UK: monthly price statistics (16 September 2026)
- ONS: Private rent and house prices, UK: September 2026
- ONS: CPI index (D7BT)
- PRA: SS13/16 Underwriting standards for buy-to-let mortgage contracts
- Leasehold Reform (Ground Rent) Act 2022
- GOV.UK: Draft Commonhold and Leasehold Reform Bill
- House of Commons Library: Leasehold reform in England and Wales: what’s happening and when?
This article is news and general guidance only, not financial, legal or tax advice.